Exhibit 99.2
|
|
Fiscal Q311 Results & Outlook November 3, 2011 1 |
Exhibit 99.2
|
|
Fiscal Q311 Results & Outlook November 3, 2011 1 |
|
|
Forward-Looking Statements 2 This presentation includes "forward-looking statements" within the meaning of the federal securities laws, commonly identified by such terms as “improve,” “will,” “expects,” “continue” and other terms with similar meaning. These statements include but are not limited to references to the Company’s Project RED initiatives, which include revenue, expense management and capital deployment strategies; anticipated new restaurant openings and performance, including our smaller prototype units; the Red Royalty™ loyalty program and other marketing promotions; our technology infrastructure overhaul; our expected effective tax rate; franchise, pricing and other strategies and our stock repurchase program. Although the Company believes that the assumptions upon which the financial information and forward-looking statements are based are reasonable, it can give no assurance that these assumptions will prove to be correct. Important factors that could cause actual results to differ materially from the Company's projections and expectations are disclosed in the Company’s filings with the Securities and Exchange Commission. These factors include, among others, our ability to effectively implement the Project Red initiatives; our ability to open new restaurants; potential fluctuation in the Company’s operating results due to economic conditions; increases in costs and seasonality and other factors; changes in cost or availability of supplies and labor; changes in availability of capital or credit facility borrowings to us and to our franchisees; possibility of inadequate systems to support our growth; impact of price increases on guest visits and changes in consumer preference; and success of our marketing strategy. All forward-looking statements in this presentation are based on information currently available to the Company, and are expressly qualified by such cautionary statements and by reference to the underlying assumptions. These statements are not guarantees of future performance and therefore undue reliance should not be placed on them. We do not undertake to publicly update forward-looking statements, whether as a result of new information, future events or otherwise. |
|
|
3 Q311 Headlines |
|
|
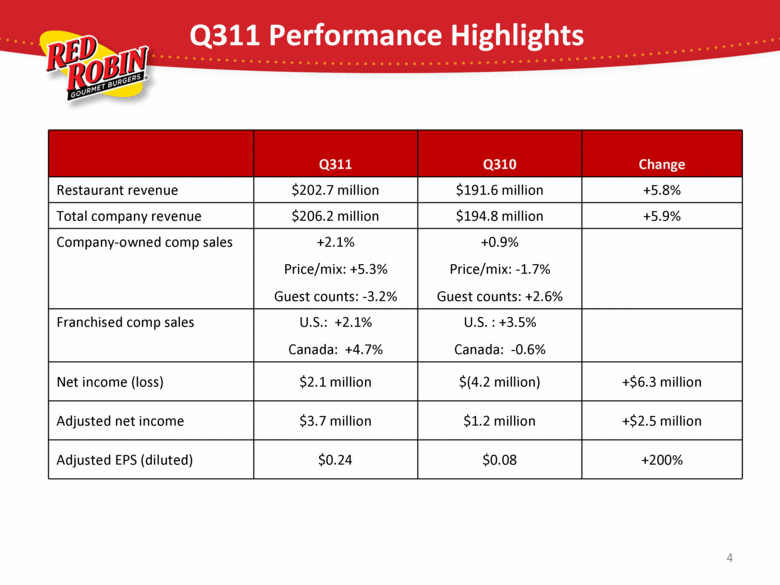
Q311 Performance Highlights Q311 Q310 Change Restaurant revenue $202.7 million $191.6 million +5.8% Total company revenue $206.2 million $194.8 million +5.9% Company-owned comp sales +2.1% Price/mix: +5.3% Guest counts: -3.2% +0.9% Price/mix: -1.7% Guest counts: +2.6% Franchised comp sales U.S.: +2.1% Canada: +4.7% U.S. : +3.5% Canada: -0.6% Net income (loss) $2.1 million $(4.2 million) +$6.3 million Adjusted net income $3.7 million $1.2 million +$2.5 million Adjusted EPS (diluted) $0.24 $0.08 +200% 4 |
|
|
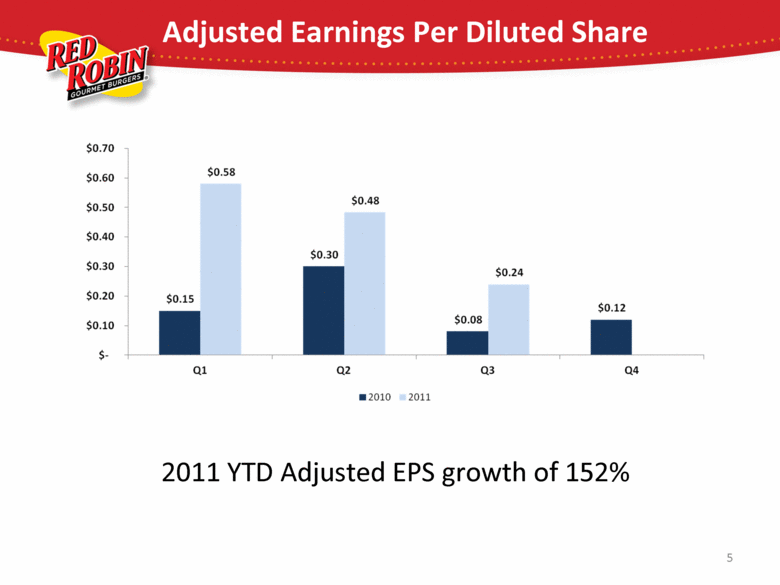
5 Adjusted Earnings Per Diluted Share 2011 YTD Adjusted EPS growth of 152% |
|
|
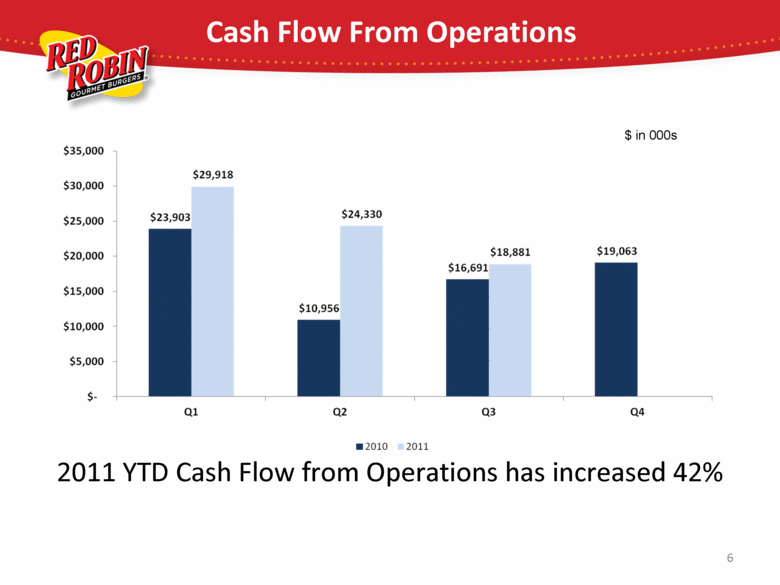
6 Cash Flow From Operations $ in 000s 2011 YTD Cash Flow from Operations has increased 42% |
|
|
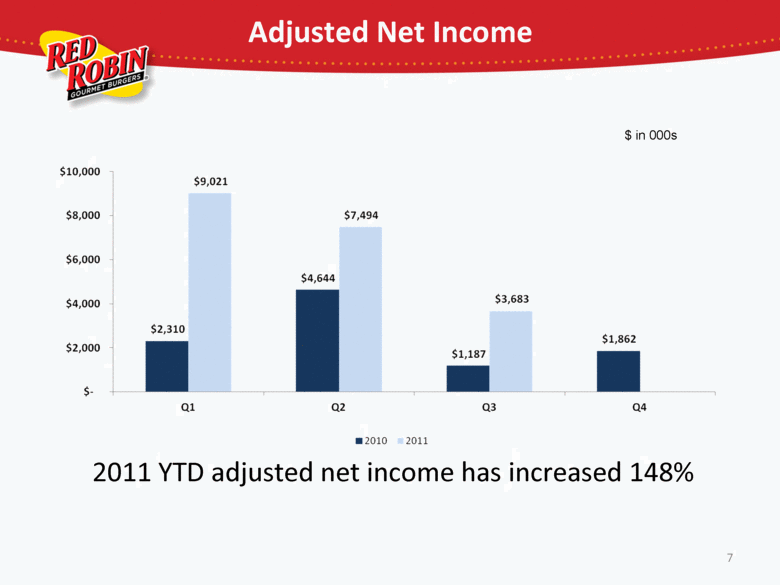
7 Adjusted Net Income 2011 YTD adjusted net income has increased 148% $ in 000s |
|
|
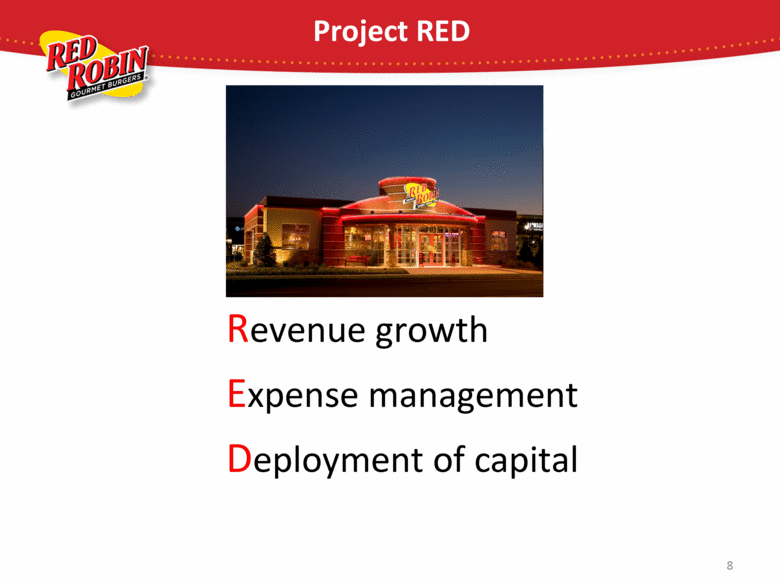
8 Project RED Revenue growth Expense management Deployment of capital |
|
|
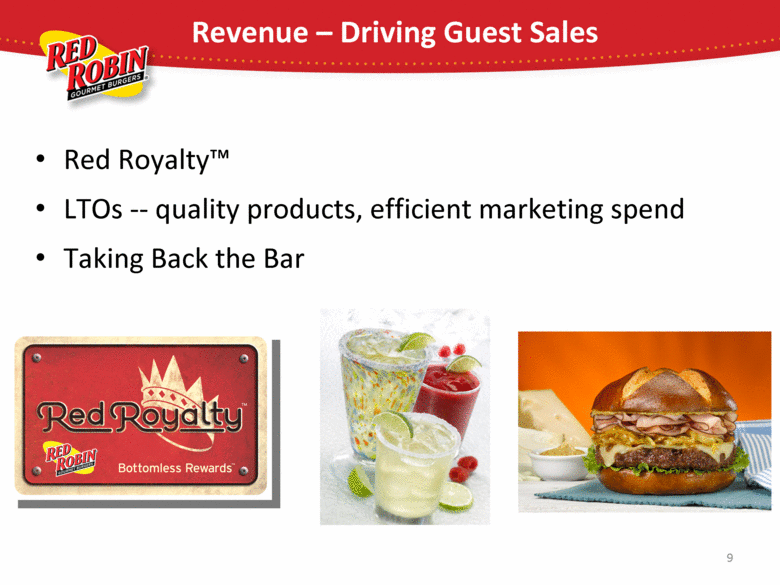
9 Revenue – Driving Guest Sales Red Royalty™ LTOs -- quality products, efficient marketing spend Taking Back the Bar |
|
|
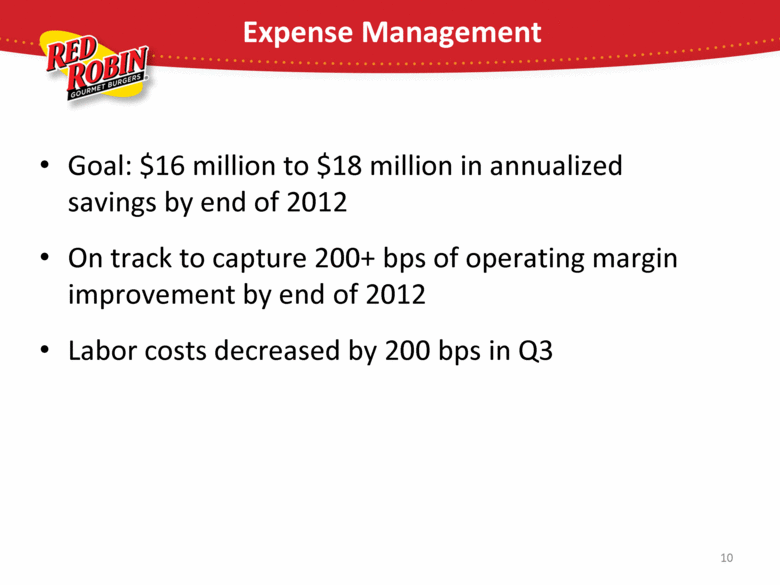
10 Expense Management Goal: $16 million to $18 million in annualized savings by end of 2012 On track to capture 200+ bps of operating margin improvement by end of 2012 Labor costs decreased by 200 bps in Q3 |
|
|
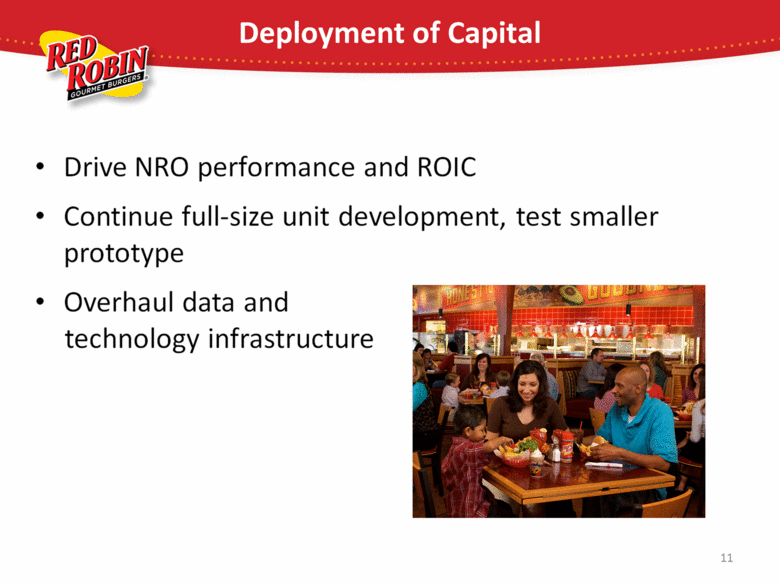
11 Deployment of Capital Drive NRO performance and ROIC Continue full-size unit development, test smaller prototype Overhaul data and technology infrastructure |
|
|
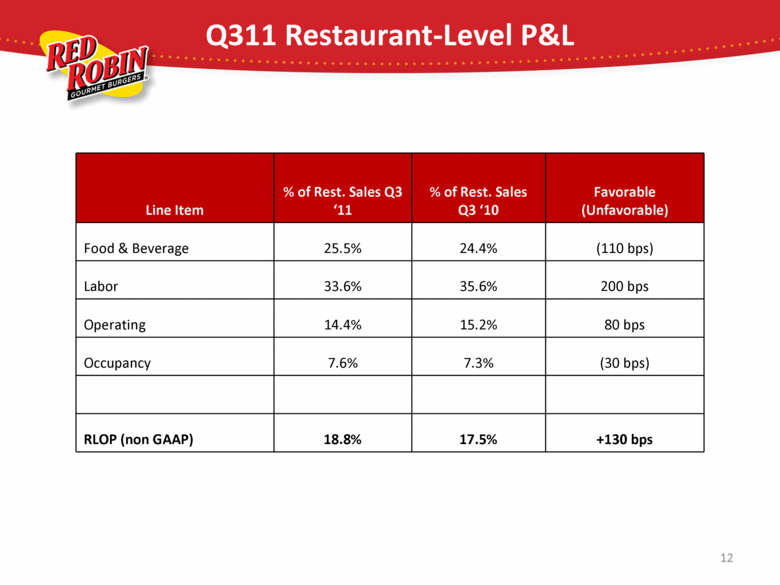
Q311 Restaurant-Level P&L Line Item % of Rest. Sales Q3 ‘11 % of Rest. Sales Q3 ‘10 Favorable (Unfavorable) Food & Beverage 25.5% 24.4% (110 bps) Labor 33.6% 35.6% 200 bps Operating 14.4% 15.2% 80 bps Occupancy 7.6% 7.3% (30 bps) RLOP (non GAAP) 18.8% 17.5% +130 bps 12 |
|
|
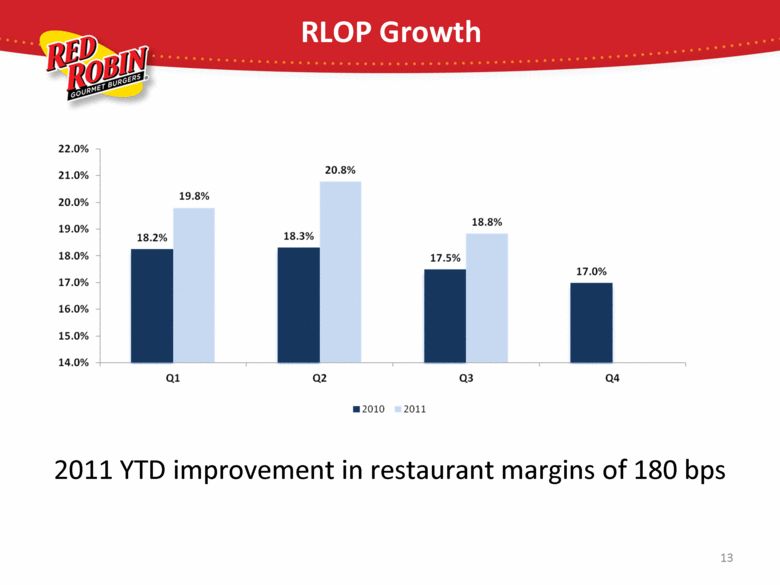
13 RLOP Growth 2011 YTD improvement in restaurant margins of 180 bps |
|
|
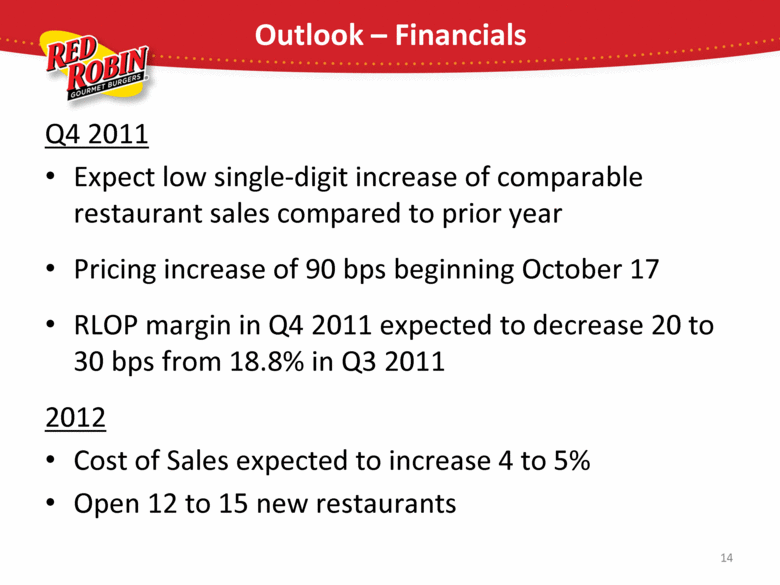
Outlook – Financials Q4 2011 Expect low single-digit increase of comparable restaurant sales compared to prior year Pricing increase of 90 bps beginning October 17 RLOP margin in Q4 2011 expected to decrease 20 to 30 bps from 18.8% in Q3 2011 2012 Cost of Sales expected to increase 4 to 5% Open 12 to 15 new restaurants 14 |
|
|
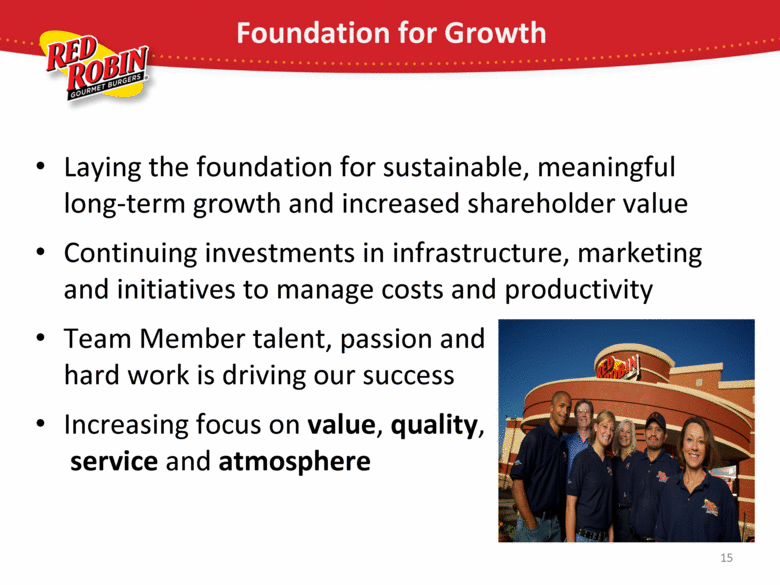
15 Foundation for Growth Laying the foundation for sustainable, meaningful long-term growth and increased shareholder value Continuing investments in infrastructure, marketing and initiatives to manage costs and productivity Team Member talent, passion and hard work is driving our success Increasing focus on value, quality, service and atmosphere |