Exhibit 99.1
|
|
FUTURE OF THE BURGER APRIL 4, 2012 1 |

Exhibit 99.1
|
|
FUTURE OF THE BURGER APRIL 4, 2012 1 |
|
|
FORWARD-LOOKING STATEMENTS 2 Forward-looking statements in this presentation regarding our future expectations, plans and objectives, including among other things, statements about our future economic performance, restaurant growth, and operational initiatives and other statements that are not historical facts, are made under the Safe Harbor provisions of the Private Securities Litigation Reform Act of 1995. These forward-looking statements are based on assumptions believed by the Company to be reasonable and speak only as of the date on which such statements are made. We undertake no obligation to update such statements to reflect events or circumstances arising after such date. We caution investors not to place undue reliance on any such forward-looking statements. Forward-looking statements involve risks and uncertainties that could cause actual results to differ materially from those described in the statements based on a number of factors and risks, including among others: the ability to continue the strategies and achieve anticipated revenue and cost savings from our operational and financial initiatives; the effectiveness of our marketing strategies, loyalty program and guest count initiatives; competition in the casual dining market and discounting by competitors; the ability to fulfill planned expansion of our restaurants, including in both new and existing markets; and other risk factors described from time to time in the “Risk Factors” section of the Company’s Annual Report on Form 10-K and other filings with the U.S. Securities and Exchange Commission. |
|
|
UNBRIDLED ACTS OF KINDNESS Video – A Recognition of Our Unbridled Culture and the Actions of A Single Restaurant. 3 |
|
|
A CHECKERED PAST 4 Memories Of Our First Location: “In the mid-70s some of us... used to go over to the Red Robin tavern for burgers and beer – we knew we wouldn’t get carded there. The burgers were great!” “I remember sitting there with my burger, with the well-known smoky haze...” “Dad told me never to go into the Red Robin. It was bad place with bad people. In 1972 when I became 21, it was one of the first places I went.” Source: Eastlakeave.com |
|
|
A COLORFUL HISTORY Video – A Historic Look At the Growth and Heritage of the Red Robin® Brand. 5 |
|
|
RED ROBIN EXECUTIVE TEAM 6 Eric Houseman President Chief Operating Officer Steve Carley Chief Executive Officer Denny Post Chief Marketing Officer Senior Vice President Annita Menogan Chief Legal Officer, Secretary Senior Vice President Todd Brighton Chief Development Officer Senior Vice President Stuart Brown Chief Financial Officer Senior Vice President Chris Laping Chief Information Officer Senior Vice President of Business Transformation |
|
|
QUALITY, ENGAGED BOARD Pattye Moore, Chair Former Executive and Board Member of Sonic Robert B. Aiken CEO Bolder Capital (food company portfolio); Former President and CEO of U.S. Foodservice Steve Carley CEO Red Robin Lloyd L. Hill Former Chairman and CEO of Applebee’s Richard J. Howell Former Audit Partner with Arthur Andersen LLP Glenn B. Kaufman Managing Member of D Cubed Group Stuart I. Oran Managing Member of Roxbury Capital Group LLC James T. Rothe Managing Director and Co-Founder of Roaring Fork Capital Management, LLC J. Taylor Simonton Former Audit Partner at PwC Marcus L. Zanner Former President of Great Western Dining 7 |
|
|
OUR STRATEGIC INTENT Own “Craveable” Gourmet Burgers Comfortable for Families and Adults Full-Service Occasions Supplemented with Non-Traditional Locations Yummm® Experiences with Everyday Value Celebrate Individuality of Our Guests’ Needs Delivered with Unbridled Spirit and Culture of Our Team Members 8 |
|
|
RR VALUE EQUATION STATE Current Future Price “$10.00 Cheeseburger” Barbell of Burgers Affordable-Premium Quality Good, But Uneven Best In Class Service Anecdotal Qualitative Driven Metric Driven Guest Experience One Size Fits All Thoughtfully Customized 9 |
|
|
STRATEGIC IMPERATIVES 10 Advancing Our Great Brand Continuously Improving Operations Building a New Foundation 10 |
|
|
KEY INITIATIVES Advancing Our Great Brand . Promise . Appeal . Environment Continuously Improving Operations . Quality and Service . Restaurant Performance . New Restaurant Openings . Team Members Building a New Foundation . Red Robin’s Burger Works™ . Restaurant Development . Technology Innovation . Yummm U™ 11 |
|
|
PEOPLE ARE TALKING Video – Featuring Media Clips, Guests, and Team Members Talking About Red Robin 12 |
|
|
ADVANCING OUR GREAT BRAND 13 |
|
|
ADVANCING OUR GREAT BRAND Brand Promise Brand Appeal Brand Refresh All Informed by Data and Supported by Talented Resources 14 |
|
|
BRAND PROMISE 15 |
|
|
BRAND PROMISE 16 |
|
|
BRAND APPEAL Lunch On The Go Time Pressured Unhurried 17 Planned? Unplanned? Adult Only Kids Present Adults Only Kids Present Dinner X X -------- High Consideration------ |
|
|
BRAND APPEAL Solidify = Broaden = 18 Red Royalty™ From Reward Program to Relationship Driver Address Barriers to Frequency Meet More of My Needs Reach New Guests |
|
|
SOLIDIFY = LOYALTY 19 |
|
|
BROADEN = ADDRESS BARRIERS Affordability Rewards Food Prices Beverage Prices Deals 20 OK To Be Loud Too Loud Kid-Centricity . . X Burger Barbell Menu Occasion-Specific Options X |
|
|
BROADEN = REACH NEW GUESTS Segment More Effectively Use Mass Media to Create Broad Awareness of Brand Building and Deepen Relationships Use Social Media to Support Brand Building and Deepen Relationships Get Our Swagger Back in Tone, Manner and Look 21 |
|
|
BRAND PROMISE 22 |
|
|
IMPROVING GUEST EXPERIENCE Environment Customized Experience 23 |
|
|
TAKING BACK THE BAR 24 |
|
|
TAKING BACK THE BAR Objectives: Increase Year-Over-Year Beverage PPA Boost Alcohol Sales as a % of Total Sales Deliver Great Adult Experiences in the Bar 25 |
|
|
TAKING BACK THE BAR Beverage Initiatives: Launch Happy Hour Revise our Beverage Menu Create Seasonal Promotions Innovate with Beverages And Glassware Establish Bar Optimization Team 26 |
|
|
TAKING BACK THE BAR Bar Environment Initiatives: Create an Adult Dining Space Enhance A/V package, Decor And Overall Bar Atmosphere Test and Learn --Colorado Tests – 3 Restaurants --25 Restaurants, 5 Markets in 2012 --Optimize and Systematize Retrofit Existing Prototypes 27 |
|
|
TAKING BACK THE BAR 28 Red Robin Castle Rock, CO |
|
|
TAKING BACK THE BAR 29 Red Robin Castle Rock, CO |
|
|
TAKING BACK THE BAR Results to Date: Regained 50 bps of Beverage Alcohol Sales Mix System Wide in FY 2011 Q411 Beverage Alcohol Sales Mix Up 90 bps Encouraging Guest Count, Sales Trends in CO Test Restaurants 30 |
|
|
CONTINUOUSLY IMPROVING OPERATIONS 31 |
|
|
IMPROVING QUALITY & SERVICE Presentation – Menu Design – Plating Menu Offerings – Heart of House Capability – Keeping Menu Fresh 32 |
|
|
NEXT GENERATION PERFORMANCE MANAGEMENT 33 |
|
|
PERFORMANCE MANAGEMENT Re-Built Balanced Scorecards Benchmark Regions, Districts and Restaurants Implications for Poor Performance Rewards for Top Performance Manual Process Today Evolving to Dashboard with System Implementations 34 |
|
|
Confidential 35 Metric Green 2 Points Yellow 1 Point Red 0 Points PROCESS BER/EcoSure Pass Without Previous Fail Pass with Previous Fail Fail GUEST Guest Counts Favorable to Budget Favorable to Last Year Unfavorable to Last Year Overall Restaurant Experience 75% or Higher 66%- 74.99% Less than 66% Negative Guest Complaints as a % of Total Guest Counts 0.0083% or Less 0.00831% - 0.0302% Greater than 0.0302% Royalty - Registrations as a % of Total Guest Counts (TBA) 1.00% or Better 0.55% - 0.999% Less than 0.55% 2012 SCORECARD CRITERIA RESTAURANT |
|
|
T M Hourly Turnover % Current Period (Green=1, Yellow=0.5,Red=0) Less than 4.62% Current Period 4.62% to 6.92% Current Period Greater than 6.92% Current Period Hourly Turnover % 3 Period Annualized (Green=1, Yellow=0.5,Red=0) Less than 60% trailing 3 periods annualized 60% - 89.99% trailing 3 periods annualized 90% or Higher trailing 3 periods annualized FINANCIAL Beverage Per Person AVG vs LY Increase by more than $0.22 over last year's Beverage PPA Increase by $0.08 to $0.22 over last year's Beverage PPA Less than $0.08 increase over last year's Beverage PPA Food Cost Var. Less than or Equal to .40% above Ideal Food Cost Greater than .40% - but less than .60% above ideal Food Cost .60% or Higher above Ideal food Cost Productivity Var. Favorable to Target Unfavorable to Target by 0.05 or less Unfavorable to Target by more than 0.05 Supplies vs. Budget Equal to or Better than Budget Unfavorable to Budget by 0.20% or less Unfavorable to Budget by more than 0.20% NIBO X % Favorable to Budget Unfavorable to Budget by 100 Basis Points (1.0%) or less Unfavorable to Budget by 100 Basis Points (1.0%) 2012 SCORECARD CRITERIA RESTAURANT CONT. |
|
|
SUCCESSFUL NEW RESTAURANTS 37 |
|
|
NEW RESTAURANTS A WINNING RECIPE Created: New Restaurant Operations Department in 2008 – The Team – Director of New Restaurant Operations – Three Regional Operating Directors – The Objective – Create a Strategic and Scalable Process for Training and Development of Leadership –Deliver Great Guest and Team Member Experiences – Create Shareholder Value 38 |
|
|
NEW RESTAURANTS LEADERSHIP PLATFORM Strategic and Scalable Process for Training and Development of Leadership. – General Managers Identified One Year Before Restaurant Opening – Must Be Existing Red Robin GM with One Year Experience Greatest Correlation to a Restaurant’s Success: A GM’s Tenure in the Red Robin System – Remainder of Management Team Identified 26 Weeks Before Opening 39 |
|
|
NEW RESTAURANTS RAISING THE BAR Proven Track Record of Driving Profitability Through NROs – Increased Restaurant Level Margins 510 bps from the 2008 Class to the 2011 Class 40 14.5% 17.9% 22.4% 19.6% 2008 2009 2010 2011 Restaurant Profit Margins* * Restaurant level profit for 1st year open. Except for 2011 which is annualized. |
|
|
NEW RESTAURANTS VALUE CREATING Compelling NRO Economics – Strengthened Cash on Cash Returns from 18% for the 2008 Class to 37% for the 2011 Class 41 18.0% 22.9% 41.7% 37.1% 2008 2009 2010 2011 Cash on Cash Returns* * Cash on cash return for 1st year open. Except for 2011 which is annualized. |
|
|
BUILDING A NEW FOUNDATION 42 |
|
|
RED ROBIN’S BURGER WORKSTM43 |
|
|
RR’S BURGER WORKS IS DIFFERENT Fresh, Fire-Grilled Burgers – Our Famous Burgers – Build Your Own Creation Red Robin Culture and Service – Deliver to Your Table – Clear Your Table – Free Drink Refills Contemporary Atmosphere 44 |
|
|
OTHER ALL STARS All-Natural Chicken Breast, Hand-Breaded Tenders Portabella Burger Fresh Salads with Grilled or Crispy Chicken Sweet Potato Fries Onion Straws Hand-Spun Shakes 45 |
|
|
“bringing a taste of gourmet” “modern décor and upbeat music” “surprised to see a variety of choices” OSU. The Lantern, 3/29/12 “Grade: A” “The biggest difference between Red Robin’s Burger Works and Five Guys is the service” DON’T TAKE OUR WORD FOR IT 46 “My burger wasjuicy, the toppings were crisp and fresh, and best of all, it didn’t taste like it had been sitting under a hot plate for hours” |
|
|
NEW MARKETS & OCCASIONS 2,500sf Size Provides Ability to Penetrate Non-Traditional Locations – Urban Centers – College Campuses – Airports – Sports Venues Appeals to Time-Pressured Guest – Expect Strong Lunch Business in Urban Locations – Open Late Night in College Locations 47 |
|
|
48 Denver Stapleton |
|
|
49 |
|
|
LIMITED TEST, GREAT POTENTIAL Expect 5 RR’s Burger Works by End 2012 – Lifestyle Center – College Campus – Downtown Evaluate Performance Metrics – Guest Feedback – Sales – Margins – Returns – Menu Potential? Time Will Tell 50 The Ohio State Univ |
|
|
RESTAURANT DEVELOPMENT 51 Confidential |
|
|
DEPARTMENT OVERVIEW Corporate Site Selection and Leasing – Due Diligence – Real Estate Committee Approval Process Red Robin’s Burger Works™ Development Franchisee Site Approval Restaurant Entitlement, Design and Construction Capital Purchasing Facilities Management Licensing Property Management Real Estate Legal Store Planning and Design 52 |
|
|
DEVELOPMENT HISTORY 53 1 3 18 46 137 306 327 1 39 98 118 133 137 - 50 100 150 200 250 300 350 400 450 500 1969 1979 1989 1999 2004 2009 2011 Corporate Franchised 464 439 255 144 57 4 1 |
|
|
POPULARITY FUELS 40+ YEARS OF GROWTH Over 460 Restaurants In U.S. and Canada . Corporate . Franchise 54 |
|
|
55 SUPERIOR, CONVENIENT LOCATIONS Located In or Near High-Traffic Malls & Shopping Centers Superior Trade Area Demographics Median Household Income of $69,000 Within 3 Miles Average Trade Area Population of 72,000 Great Relationships with Developers, Landlords, Retailers |
|
|
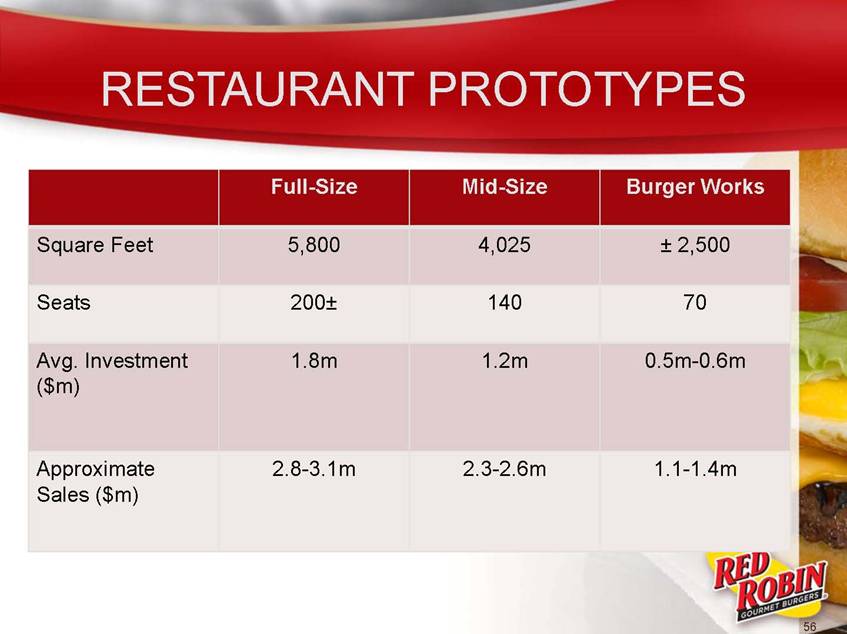
RESTAURANT PROTOTYPES Full-Size Mid-Size Burger Works Square Feet 5,800 4,025 ± 2,500 Seats 200± 140 70 Avg. Investment ($m) 1.8m 1.2m 0.5m-0.6m Approximate Sales ($m) 2.8-3.1m 2.3-2.6m 1.1-1.4m 56 |
|
|
SITE SELECTION CONSIDERATIONS Types of Sites Vary – Regional Malls – Big Box Power Centers – Life Style Centers Prototype Flexibility Diverse Customer Base – Population Density – Day-Part Population – Income Levels Availability of Prime Locations/Relationships with Real Estate Developers 57 |
|
|
58 2012 DEVELOPMENT PLAN Open 7-8 Prototype, 2-3 Mid-Size, and 4 RR Burger Works (plus 2 relocations) Regional, Targeted Market Expansion Continue to Fill Pipeline of Potential Deals to Facilitate 15- 20 Openings Beyond 2012 – Further Explore Non-Traditional Locations – Mixture of Full-Size Prototype, Mid-Size, and RR Burger Works Depending on Opportunity – Blend of Free-Standing, Mall, End caps, In-Line, and Conversions |
|
|
59 2012 DEVELOPMENT PLAN, CONT. Utilized Birchwood Resultants to Validate Selection Criteria and Evaluate Potential Sites Selecting Sites Opportunistically Versus Limiting Certain Markets for Only Corporate or Franchise Development Test Brand Refresh in Existing Facilities and Complete Design Work for New Facilities – 25 Target Locations Flexibility of Footprints Allows Better Market Penetration and Entry Into More Urban Areas and Tertiary Markets Where Retail, Employment, and Residential are All Available at Desired Criteria Level |
|
|
2012 EXPECTED OPENINGS Under Lease or Negotiation – Florida: 4 – New York/New Jersey: 2-3 new plus 1 franchisee acquisition – Washington: 2 – California: 2 – Colorado: 2 (RRBW) – Ohio: 1 (RRBW) – Maine: 1 Other – Relocations/conversions: Tustin, CA and Boulder, CO (RRBW) Close: Two Locations 60 |
|
|
61 61 OTHER INITIATIVES Rebranding with Lippincott Energy Management System Facilities Management System Non Traditional Locations Sourced for 2013 and Beyond Value Engineering Productivity Advantage |
|
|
MARYLAND MARKET STUDY Maryland market has been developed over past 12 years on a “project driven” basis, taking into account the undeveloped trade areas in the market when opportunities arose for expansion Measured development over time allowed for development of seasoned managers in future stores Also considered liquor license limitations by county All of above has allowed Red Robin to establish a strong foundation in Maryland for any future development, including 2013 potential new restaurants in Crofton, Hagarstown, Canton and Arundel Mills 62 |
|
|
Confidential 63 MARYLAND MARKET MAP |
|
|
MARYLAND MARKET TIMELINE DATE OPENED RESTAURANT DEAL TYPE 1-31-2000 Owings Mills Pad 6-11-2001 Annapolis Mall 9-4-2001 Lake Forest Mall 4-15-2001 Germantown Pad 3-31-2003 Columbia Crossing Purchase 11-8-2004 Waldorf Pad 11-14-2004 Towson Pad 9-22-2008 Bel Air Mall 8-23-2010 Lexington Park Full raw site 1-10-2011 Bowie End Cap 5-30-2011 Frederick Pad 10-10-2011 White Marsh Mall 64 |
|
|
NEW JERSEY MARKET DEVELOPMENT DATE OPENED RESTAURANT DEAL TYPE 10-10-2005 Hamilton Pad 6-26-2006 South Plainfield Pad 3-30-2009 May’s Landing Pad 11-22-2010 Rockaway Pad 65 |
|
|
FLORIDA MARKET DEVELOPMENT DATE OPENED RESTAURANT DEAL TYPE 8-13-2007 Gulf Coast TC End Cap 3-9-2009 Panama City End Cap 3-16-2009 Pensacola Mall 3-15-2010 Daytona Beach End Cap 8-30-2010 Citrus Park (Tampa) Mall 11-15-2010 Wiregrass (Tampa) Pad 66 |
|
|
DEVELOPMENT POTENTIAL Continued Growth for Mid-Size and Full-Size Prototype Restaurants15-20 Annually Growth for RRBWTBD Remodel of all Restaurants Over Next 3-4 Years with Initial 25 to be Completed in 2012 Confidential 67 |
|
|
INNOVATION: 2012 & BEYOND 68 |
|
|
INNOVATION GOALS Build a Culture of Innovation and Change Focus on Continuous Improvement and Guest-Facing Experience-Builders Drive Strategy with Unique Information Insights Empower Team Members to be Best-In-Class with Relevant Development Programs and Dynamic Best-In-Class Tools 69 |
|
|
WHAT DOES THIS LOOK LIKE? 70 Video – A Look at Some Potential Technologies and Applications to Enhance the Total Red Robin Experience |
|
|
INNOVATION INVESTMENTS 71 |
|
|
72 |
|
|
73 Transactional: Point of Sale, Red Royalty – Sales, Guest Count, Mix, PPA, etc. Operational: Operations Standards – Ticket Times, Wait Times, etc. Insights: Guest Voice, Social Media, Consumer Data |
|
|
YUMMMU. 74 |
|
|
75 |
|
|
IMPROVING RETURNS TO SHAREHOLDERS 76 |
|
|
OUR FINANCIAL PRIORITIES Realize Organic Growth Opportunities Pursue New Unit Growth with Focus on ROIC Capitalize on External Growth Opportunities Improve Margins by Leveraging G&A Maintain Strong Financial Position Return Excess Cash to Shareholders Transparency and Communication 77 |
|
|
PRIORITIES TIED TO STRATEGY 78 Advancing Our Great Brand Continuously Improving Operations Building a New Foundation 78 |
|
|
3 TO 5 YEAR INVESTMENT CYCLE Maintenance; Information and Other Systems 79 Maintenance Capital Organic Growth Expansion Investments New Units; RR Burger Works; Franchising Item Development and Kitchen Equipment; Red Royalty; Remodeling with Brand Refresh |
|
|
PREPARED FOR A TOUGH ENVIRONMENT Economic Growth Slow and Uneven Consumer Sentiment Fickle Competition Intense Commodity Inflation Continuing 80 |
|
|
LEVERAGE OUR ASSETS 81 Brand Capabilities Culture Quality and Differentiation “Yummm” Family Consideration Customer Segment National Footprint UBA – Culture of Caring Guest Service Team Member Support Relationships Menu Development Red Royalty System Development Business Transformation Financial Position |
|
|
TARGET GROWTH MODEL 82 Balanced Predictable EBITDA and ROIC Growth 2012 1 2013 2014 New Unit Growth Red Robin 9 to 11 15 to 20 20 to 25 New Unit Growth Burger Works 4 5 to 10 ? Comparable Restaurant Sales Growth Low Single Digits Low Single Digits Low Single Digits Franchise Royalty Growth ~ 3% 3%-4% 4%-5% Restaurant Level Operating Margins ~ 20.0% +10-20 Bps +10-20 Bps SG&A $105M - $107M Flat with 2012 3%-4% Growth EPS Growth Target Upper Teens Mid Teens + Mid Teens + 1 2012 consists of 53 weeks |
|
|
GENERATING SIGNIFICANT CASH 83 93,558 91,164 90,615 70,613 95,697 50,000 60,000 70,000 80,000 90,000 100,000 2007 2008 2009 2010 2011 Cash Flow from Operations ($ 000s) |
|
|
INVESTING ACCRETIVELY Organic Growth Expansion Other Opportunities Manage Cost of Capital and Leverage 84 Return Excess Cash to Shareholders ADJUSTED DEBT to EBITDAR Red Robin 3.9X Casual Dining Peers (average) 3.2X Goldman Sachs, March 2012 |
|
|
POISED FOR NEXT CYCLE Secure, Long-Term Growth Adding Truly Best-In-Class Business Intelligence Preparing Foundation with Brand and Facilities Development Financial Condition to Capture Opportunities 85 |
|
|
WRAP UP 86 |
|
|
A LONG RUNWAY FOR GROWTH Potential 200+ Domestic RRGBs over 5 years RRBW Non-Traditional Potential (Colleges/Airports/Stadiums/Urban) Franchising International Food Truck Licensing (Sauces/Seasoning/Dressings) Technology (Business Info/Op Efficiency/Guest Facing) Merchandising Carry-Out/To-Go Catering Brand Evolution (Remodels/Millenials/Take Back the Bar) 87 |
|
|
QUESTIONS? 88 |