Exhibit 99.2
|
|
Fiscal Q113 Results May 21, 2013 |
Exhibit 99.2
|
|
Fiscal Q113 Results May 21, 2013 |
|
|
Forward-Looking Statements 2 |
|
|
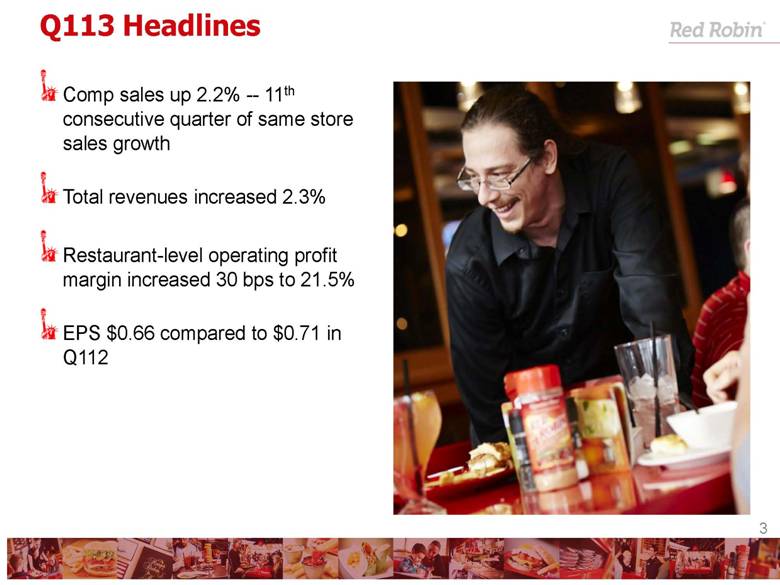
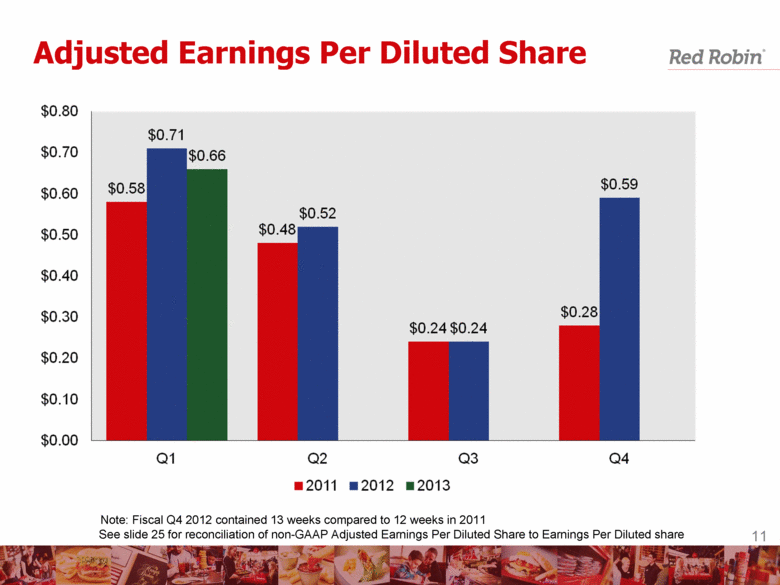
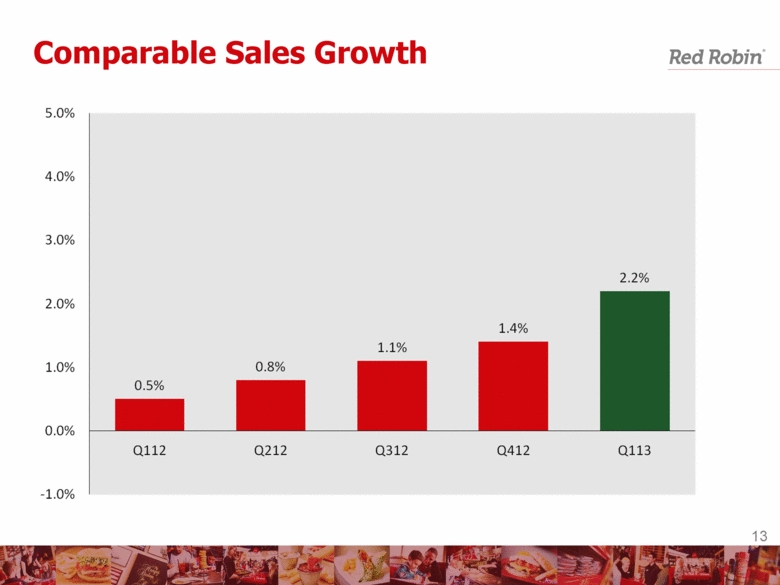
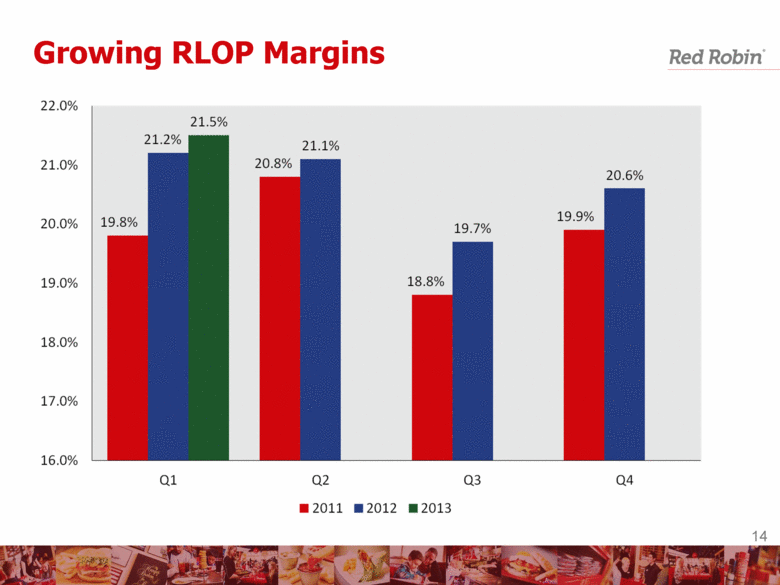
Comp sales up 2.2% -- 11th consecutive quarter of same store sales growth Total revenues increased 2.3% Restaurant-level operating profit margin increased 30 bps to 21.5% EPS $0.66 compared to $0.71 in Q112 Q113 Headlines 3 |
|
|
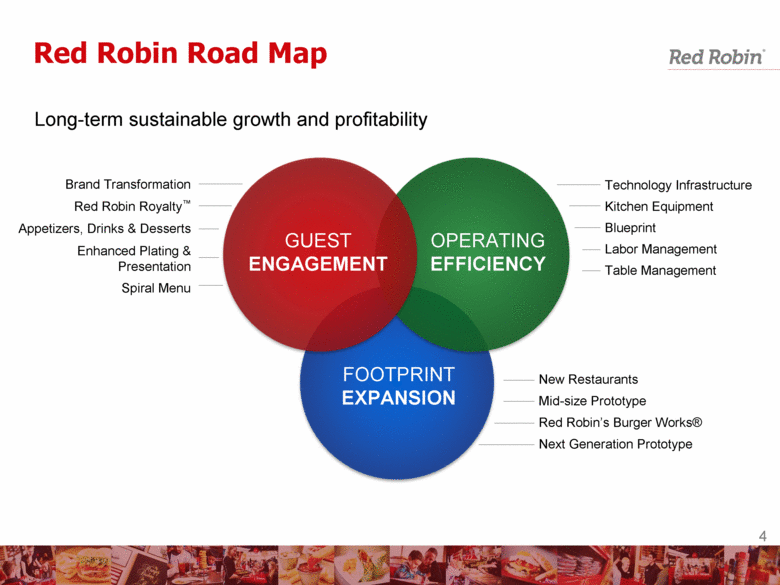
Long-term sustainable growth and profitability Red Robin Road Map GUEST ENGAGEMENT OPERATING EFFICIENCY FOOTPRINT EXPANSION Brand Transformation Red Robin Royalty™ Appetizers, Drinks & Desserts Enhanced Plating & Presentation Spiral Menu Technology Infrastructure Kitchen Equipment Blueprint Labor Management Table Management New Restaurants Mid-size Prototype Red Robin’s Burger Works® Next Generation Prototype 4 |
|
|
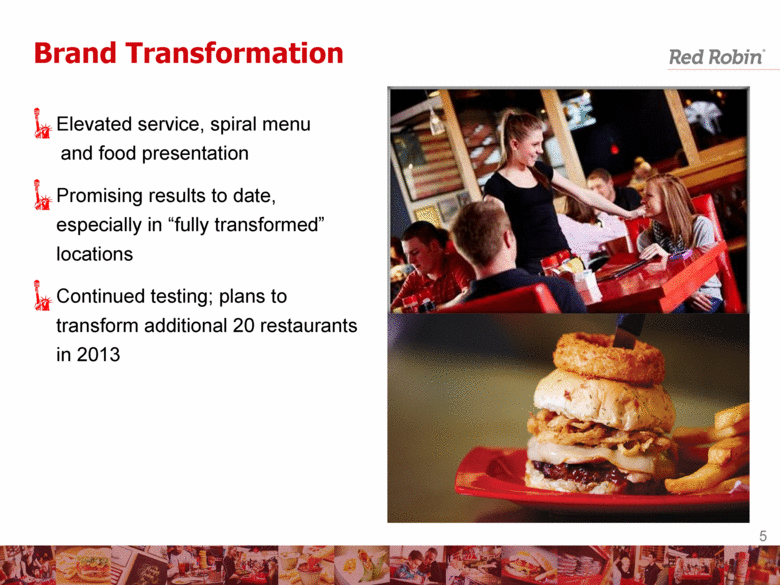
Brand Transformation Elevated service, spiral menu and food presentation Promising results to date, especially in “fully transformed” locations Continued testing; plans to transform additional 20 restaurants in 2013 5 |
|
|
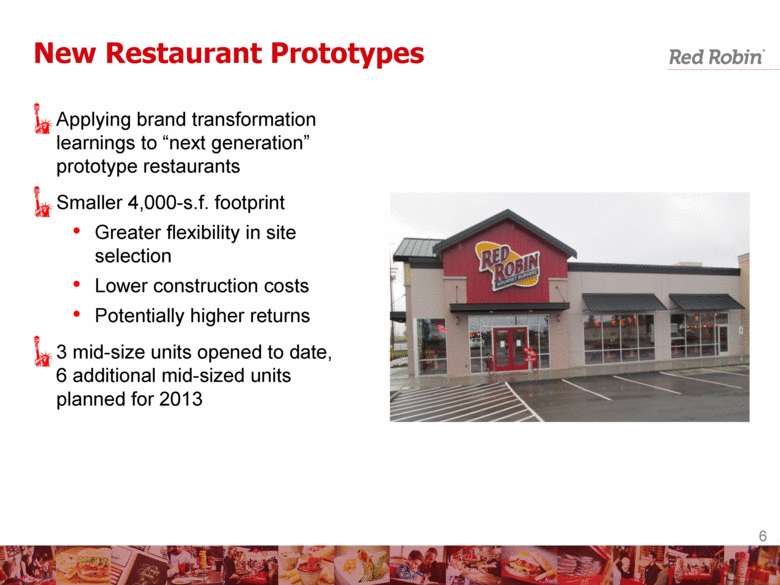
New Restaurant Prototypes Applying brand transformation learnings to “next generation” prototype restaurants Smaller 4,000-s.f. footprint Greater flexibility in site selection Lower construction costs Potentially higher returns 3 mid-size units opened to date, 6 additional mid-sized units planned for 2013 6 |
|
|
Marketing Update 7 |
|
|
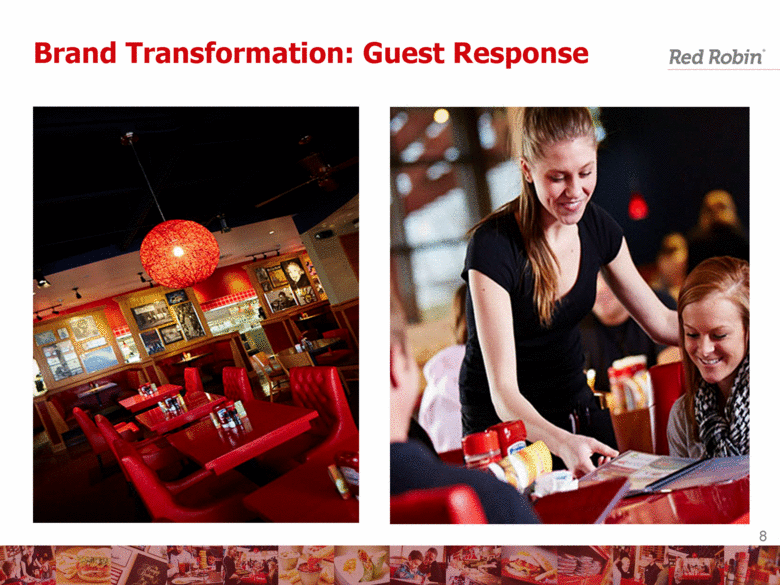
Brand Transformation: Guest Response 8 |
|
|
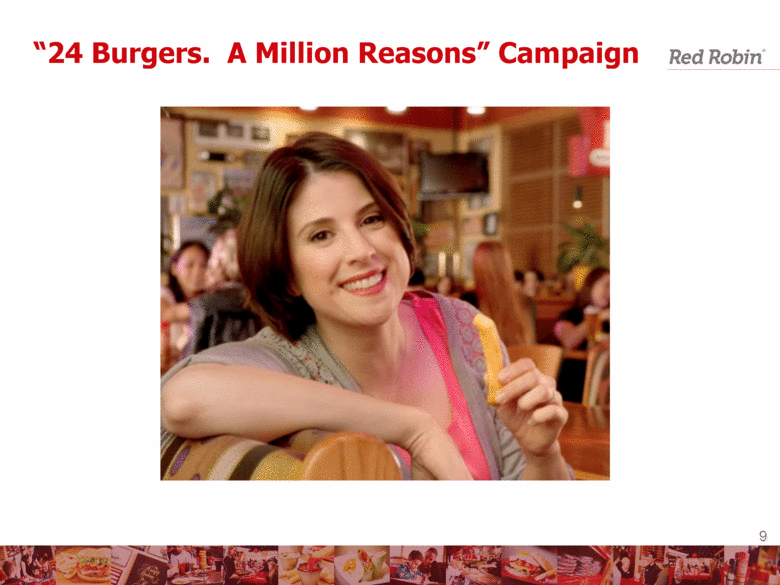
“24 Burgers. A Million Reasons” Campaign 9 |
|
|
Financial Update 10 |
|
|
Adjusted Earnings Per Diluted Share Note: Fiscal Q4 2012 contained 13 weeks compared to 12 weeks in 2011 11 See slide 25 for reconciliation of non-GAAP Adjusted Earnings Per Diluted Share to Earnings Per Diluted share |
|
|
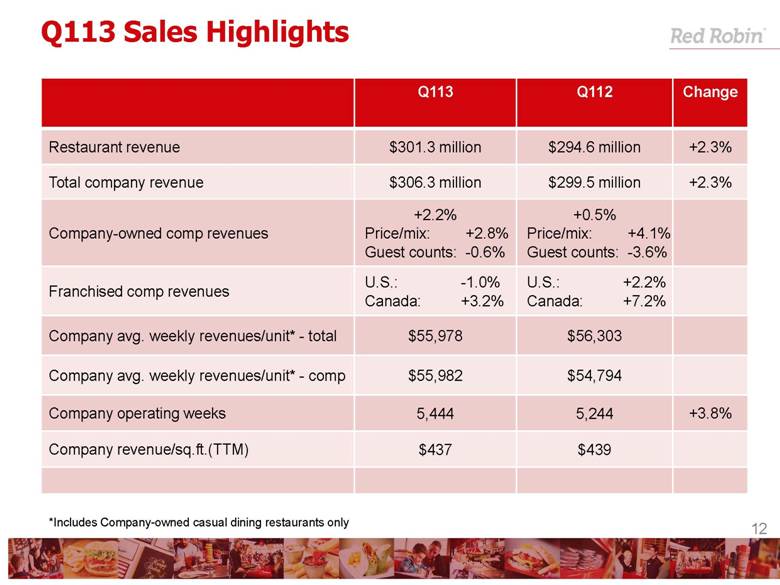
Q113 Q112 Change Restaurant revenue $301.3 million $294.6 million +2.3% Total company revenue $306.3 million $299.5 million +2.3% Company-owned comp revenues +2.2% Price/mix: +2.8% Guest counts: -0.6% +0.5% Price/mix: +4.1% Guest counts: -3.6% Franchised comp revenues U.S.: -1.0% Canada: +3.2% U.S.: +2.2% Canada: +7.2% Company avg. weekly revenues/unit* - total $55,978 $56,303 Company avg. weekly revenues/unit* - comp $55,982 $54,794 Company operating weeks 5,444 5,244 +3.8% Company revenue/sq.ft.(TTM) $437 $439 Q113 Sales Highlights *Includes Company-owned casual dining restaurants only 12 |
|
|
Comparable Sales Growth 13 |
|
|
Growing RLOP Margins 14 |
|
|
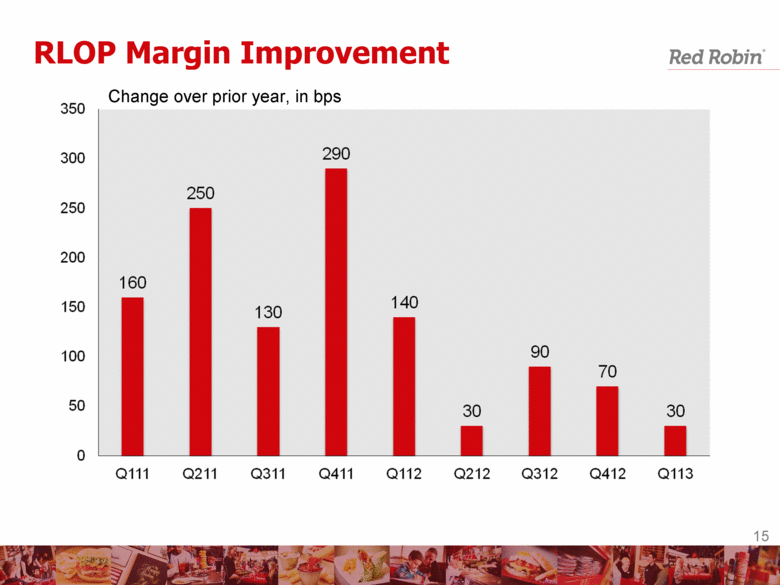
RLOP Margin Improvement Change over prior year, in bps 15 |
|
|
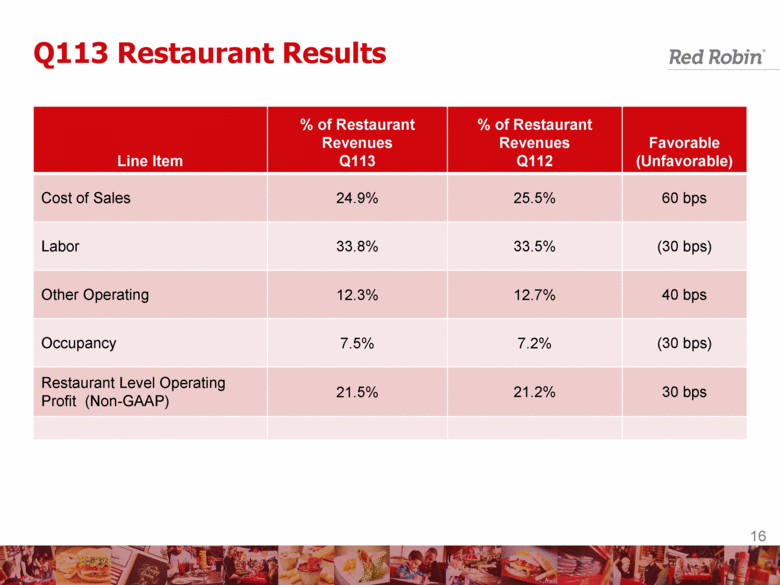
Line Item % of Restaurant Revenues Q113 % of Restaurant Revenues Q112 Favorable (Unfavorable) Cost of Sales 24.9% 25.5% 60 bps Labor 33.8% 33.5% (30 bps) Other Operating 12.3% 12.7% 40 bps Occupancy 7.5% 7.2% (30 bps) Restaurant Level Operating Profit (Non-GAAP) 21.5% 21.2% 30 bps Q113 Restaurant Results 16 |
|
|
Adjusted EBITDA $ in millions 17 |
|
|
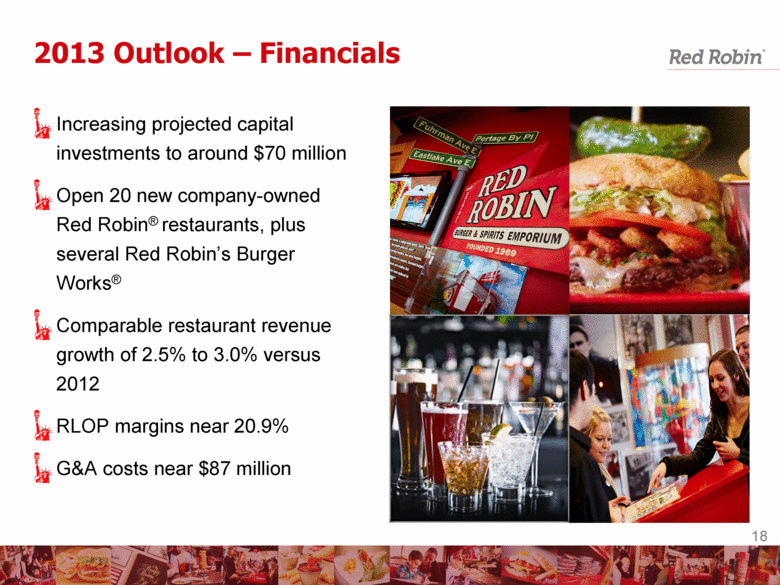
2013 Outlook – Financials Increasing projected capital investments to around $70 million Open 20 new company-owned Red Robin® restaurants, plus several Red Robin’s Burger Works® Comparable restaurant revenue growth of 2.5% to 3.0% versus 2012 RLOP margins near 20.9% G&A costs near $87 million 18 |
|
|
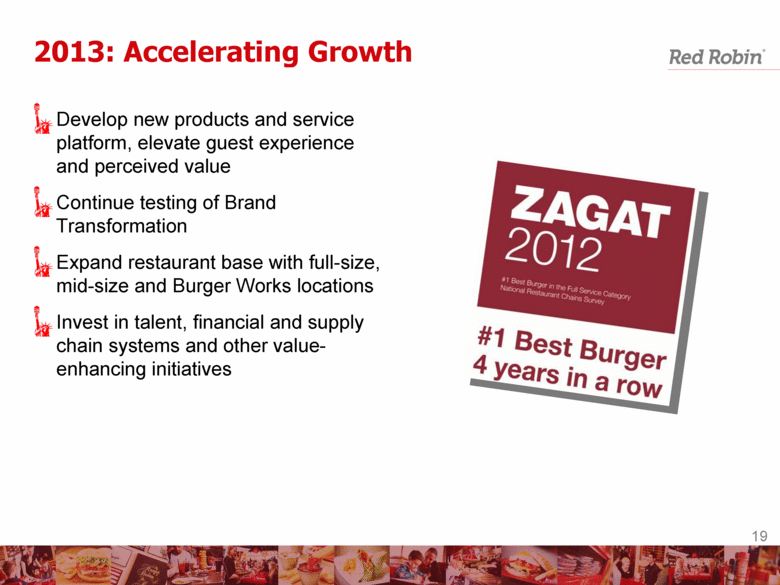
Develop new products and service platform, elevate guest experience and perceived value Continue testing of Brand Transformation Expand restaurant base with full-size, mid-size and Burger Works locations Invest in talent, financial and supply chain systems and other value-enhancing initiatives 2013: Accelerating Growth 19 |
|
|
Appendix 20 |
|
|
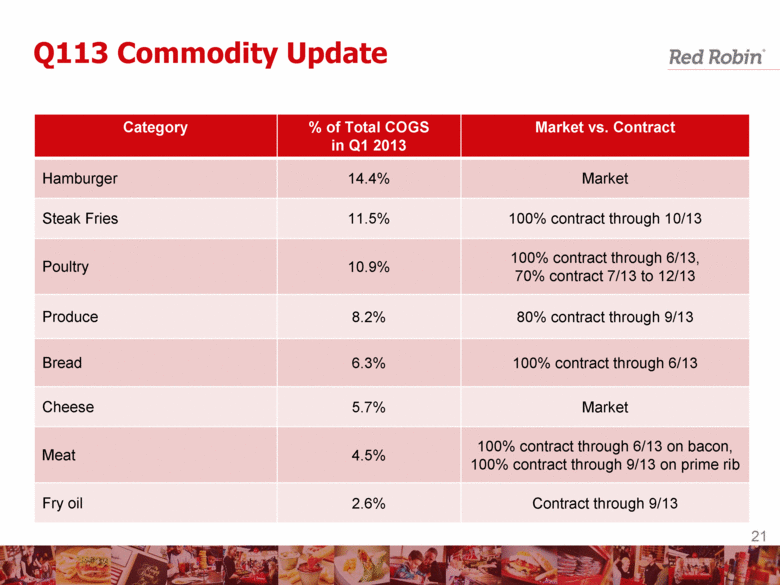
Category % of Total COGS in Q1 2013 Market vs. Contract Hamburger 14.4% Market Steak Fries 11.5% 100% contract through 10/13 Poultry 10.9% 100% contract through 6/13, 70% contract 7/13 to 12/13 Produce 8.2% 80% contract through 9/13 Bread 6.3% 100% contract through 6/13 Cheese 5.7% Market Meat 4.5% 100% contract through 6/13 on bacon, 100% contract through 9/13 on prime rib Fry oil 2.6% Contract through 9/13 Q113 Commodity Update 21 |
|
|
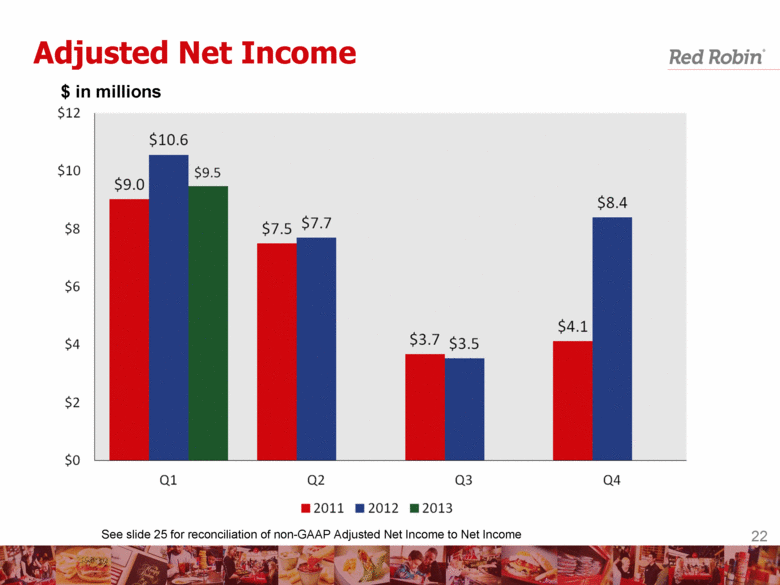
Adjusted Net Income $ in millions 22 See slide 25 for reconciliation of non-GAAP Adjusted Net Income to Net Income |
|
|
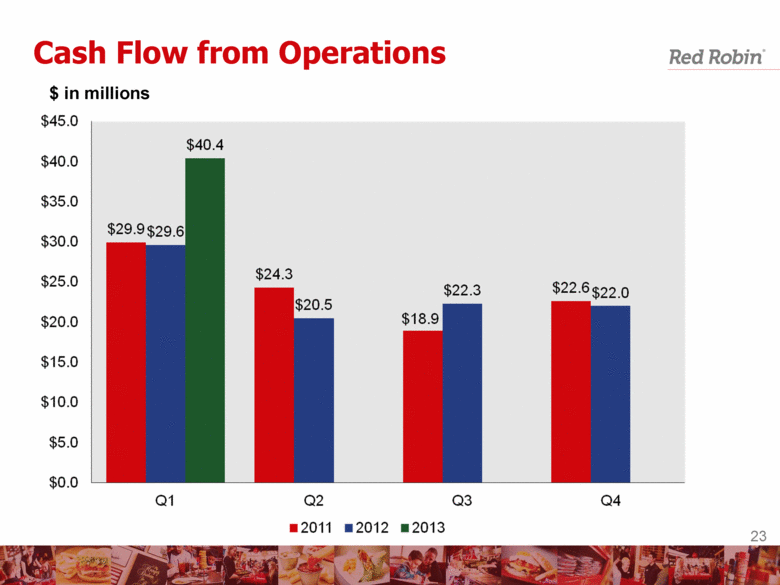
Cash Flow from Operations $ in millions 23 |
|
|
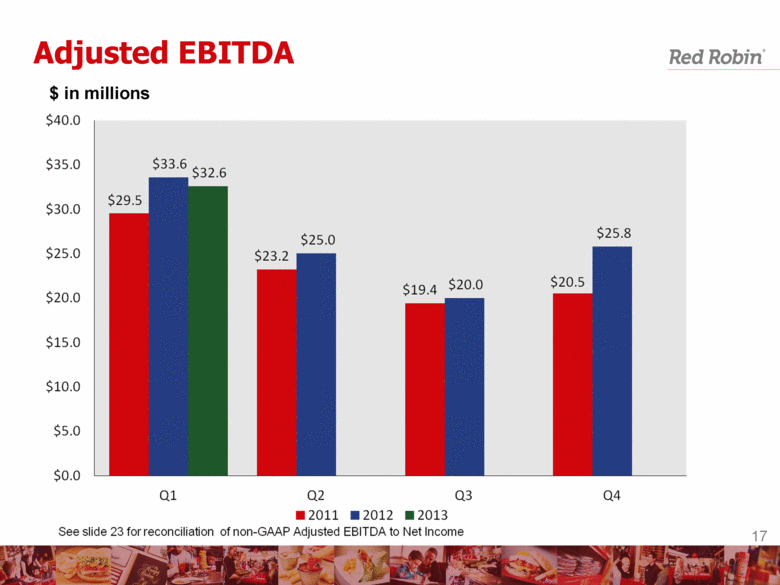
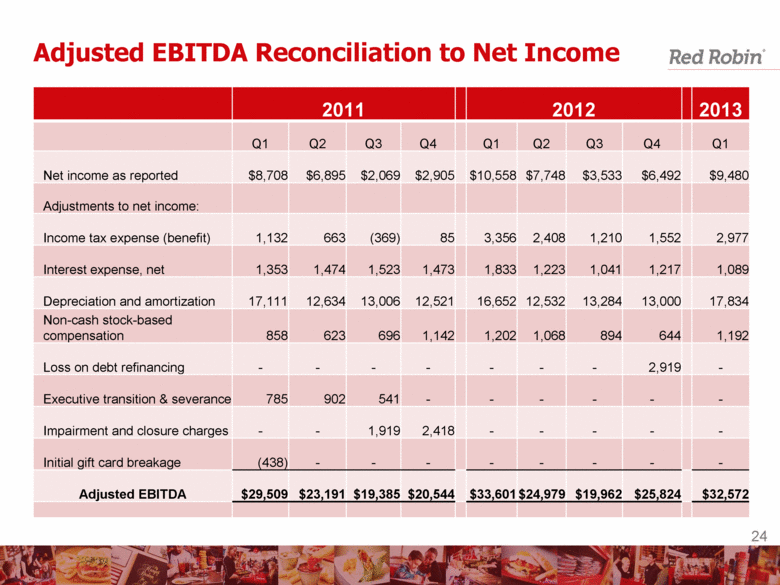
Adjusted EBITDA Reconciliation to Net Income 2011 2012 2013 Q1 Q2 Q3 Q4 Q1 Q2 Q3 Q4 Q1 Net income as reported $8,708 $6,895 $2,069 $2,905 $10,558 $7,748 $3,533 $6,492 $9,480 Adjustments to net income: Income tax expense (benefit) 1,132 663 (369) 85 3,356 2,408 1,210 1,552 2,977 Interest expense, net 1,353 1,474 1,523 1,473 1,833 1,223 1,041 1,217 1,089 Depreciation and amortization 17,111 12,634 13,006 12,521 16,652 12,532 13,284 13,000 17,834 Non-cash stock-based compensation 858 623 696 1,142 1,202 1,068 894 644 1,192 Loss on debt refinancing - - - - - - - 2,919 - Executive transition & severance 785 902 541 - - - - - - Impairment and closure charges - - 1,919 2,418 - - - - - Initial gift card breakage (438) - - - - - - - - Adjusted EBITDA $29,509 $23,191 $19,385 $20,544 $33,601 $24,979 $19,962 $25,824 $32,572 24 |
|
|
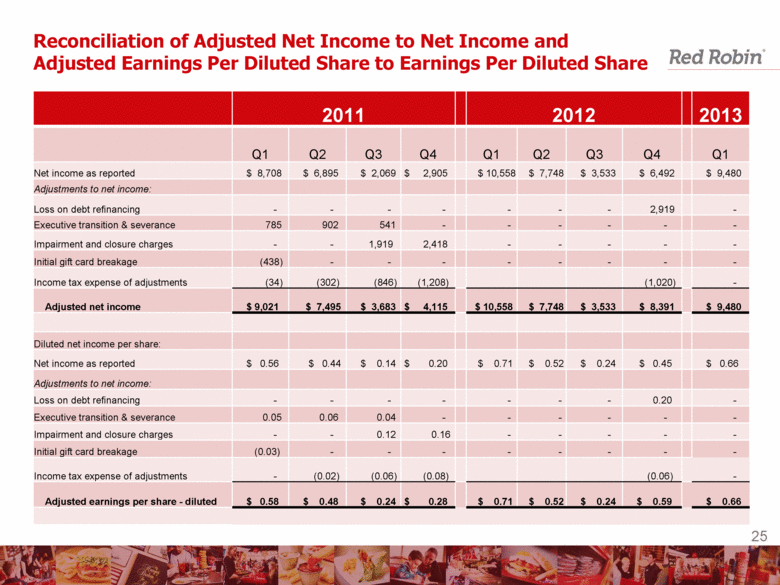
Reconciliation of Adjusted Net Income to Net Income and Adjusted Earnings Per Diluted Share to Earnings Per Diluted Share 2011 2012 2013 Q1 Q2 Q3 Q4 Q1 Q2 Q3 Q4 Q1 Net income as reported $ 8,708 $ 6,895 $ 2,069 $ 2,905 $ 10,558 $ 7,748 $ 3,533 $ 6,492 $ 9,480 Adjustments to net income: Loss on debt refinancing - - - - - - - 2,919 - Executive transition & severance 785 902 541 - - - - - - Impairment and closure charges - - 1,919 2,418 - - - - - Initial gift card breakage (438) - - - - - - - - Income tax expense of adjustments (34) (302) (846) (1,208) (1,020) - Adjusted net income $ 9,021 $ 7,495 $ 3,683 $ 4,115 $ 10,558 $ 7,748 $ 3,533 $ 8,391 $ 9,480 Diluted net income per share: Net income as reported $ 0.56 $ 0.44 $ 0.14 $ 0.20 $ 0.71 $ 0.52 $ 0.24 $ 0.45 $ 0.66 Adjustments to net income: Loss on debt refinancing - - - - - - - 0.20 - Executive transition & severance 0.05 0.06 0.04 - - - - - - Impairment and closure charges - - 0.12 0.16 - - - - - Initial gift card breakage (0.03) - - - - - - - - Income tax expense of adjustments - (0.02) (0.06) (0.08) (0.06) - Adjusted earnings per share - diluted $ 0.58 $ 0.48 $ 0.24 $ 0.28 $ 0.71 $ 0.52 $ 0.24 $ 0.59 $ 0.66 25 |