Exhibit 99.2
|
|
Fiscal Q413 Results February 14, 2014 |
Exhibit 99.2
|
|
Fiscal Q413 Results February 14, 2014 |
|
|
Forward-Looking Statements Forward-looking statements in this presentation regarding our expected restaurant sales growth, new restaurant openings, future economic performance, costs and capital expenditures and investments, certain statements under the heading “2014 Outlook -- Financials” and all other statements that are not historical facts, are made under the safe harbor provisions of the Private Securities Litigation Reform Act of 1995. These statements are based on assumptions believed by the Company to be reasonable and speak only as of the date on which such statements are made. Without limiting the generality of the foregoing, words such as “expect,” “believe,” “anticipate,” “intend,” “plan,” “continue,” “develop,” “expand,” “evolve,” or “estimate,” or the negative or other variations thereof or comparable terminology are intended to identify forward-looking statements. We undertake no obligation to update such statements to reflect events or circumstances arising after such date, and we caution investors not to place undue reliance on any such forward-looking statements. Forward-looking statements involve risks and uncertainties that could cause actual results to differ materially from those described in the statements based on a number of factors, including but not limited to the following: the effectiveness of the Company’s marketing strategies, loyalty program and guest count initiatives to achieve restaurant sales growth; the ability to fulfill planned expansion and restaurant remodeling; the cost and availability of key food products, labor and energy; the ability to achieve anticipated revenue and cost savings from our anticipated new technology systems and other initiatives; availability of capital or credit facility borrowings; the adequacy of cash flows or available debt resources to fund operations and growth opportunities; federal, state and local regulation of our business; and other risk factors described from time to time in the Company’s Form 10-K, Form 10-Q and Form 8-K reports (including all amendments to those reports) filed with the U.S. Securities and Exchange Commission. This presentation may also contain non-GAAP financial information. Management uses this information in its internal analysis of results and believes that this information may be informative to investors in gauging the quality of our financial performance, identifying trends in our results and providing meaningful period- to-period comparisons. For a reconciliation of non- GAAP measures presented in this document, see the Appendix of this presentation. 1 |
|
|
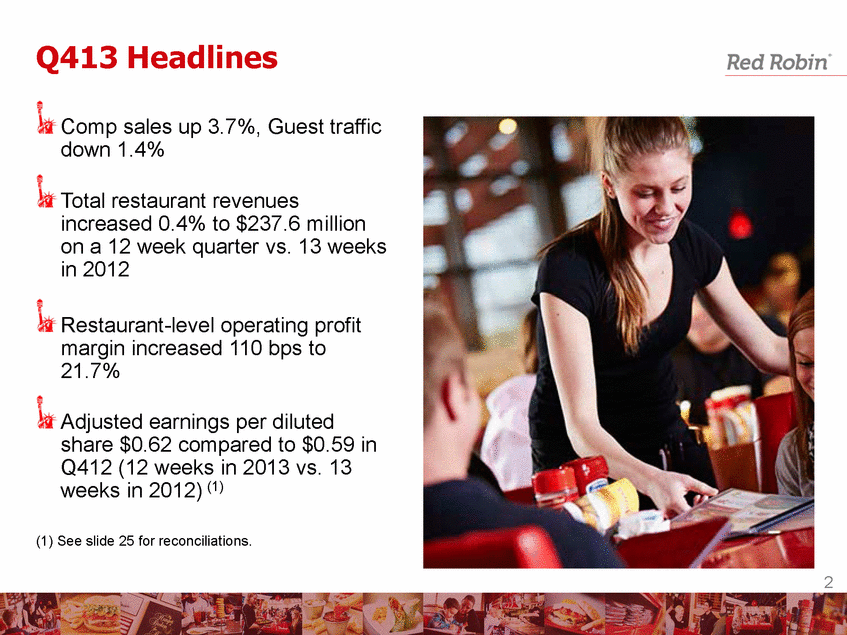
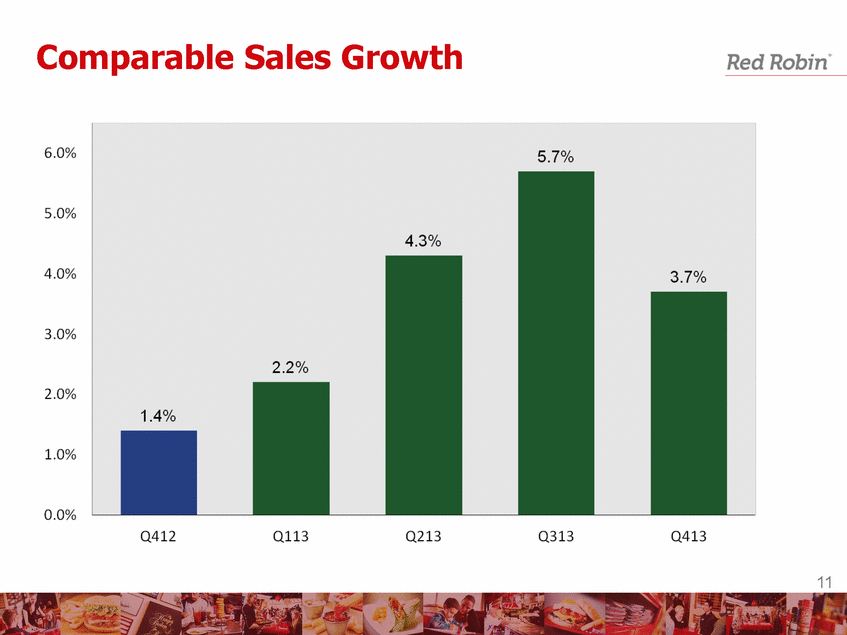
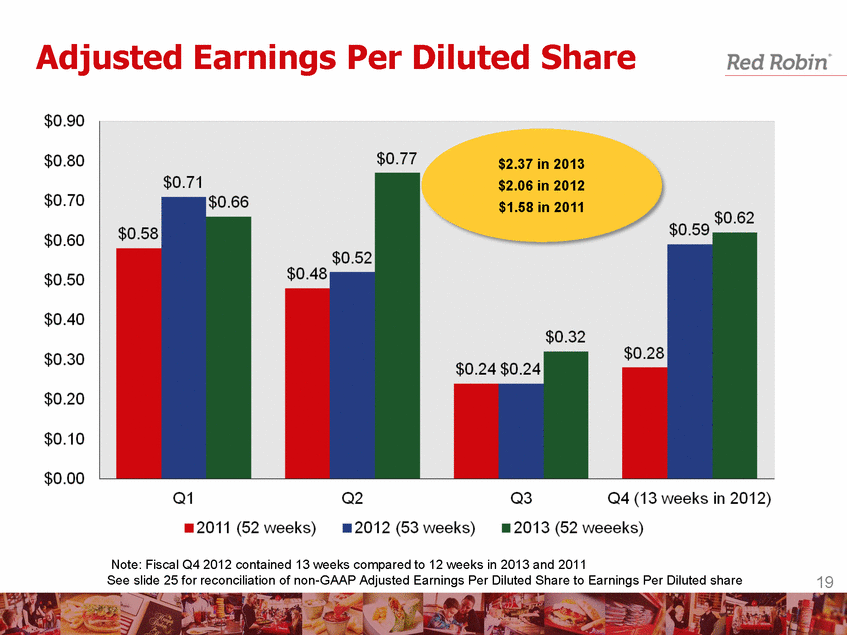
Q413 Headlines Comp sales up 3.7%, Guest traffic down 1.4% Total restaurant revenues increased 0.4% to $237.6 million on a 12 week quarter vs. 13 weeks in 2012 Restaurant-level operating profit margin increased 110 bps to 21.7% Adjusted earnings per diluted share $0.62 compared to $0.59 in Q412 (12 weeks in 2013 vs. 13 weeks in 2012) (1) (1) See slide 25 for reconciliations. 2 |
|
|
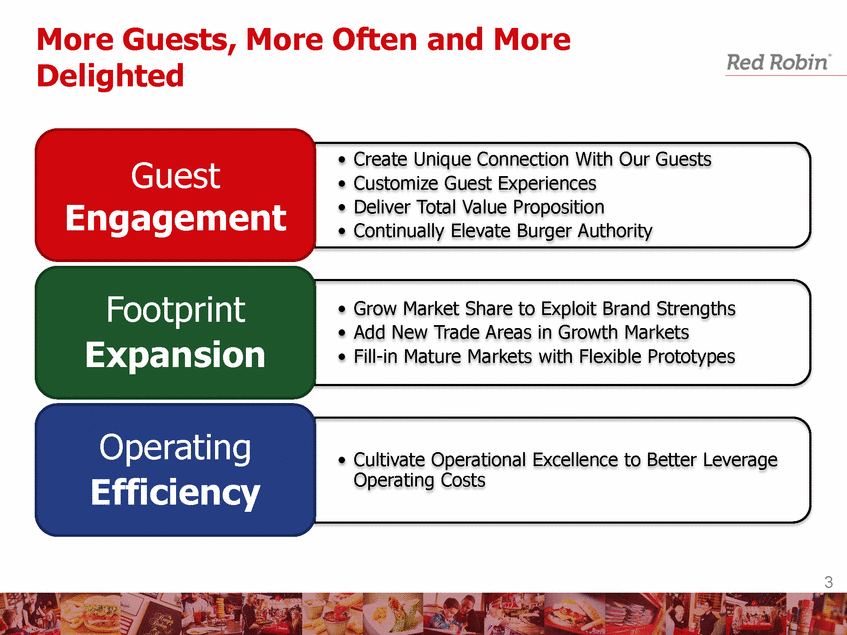
More Guests, More Often and More Delighted •Create Unique Connection With Our Guests •Customize Guest Experiences •Deliver Total Value Proposition •Continually Elevate Burger Authority Guest Engagement •Grow Market Share to Exploit Brand Strengths •Add New Trade Areas in Growth Markets •Fill-in Mature Markets with Flexible Prototypes Footprint Expansion • Cultivate Operational Excellence to Better Leverage Operating Costs Operating Efficiency 3 |
|
|
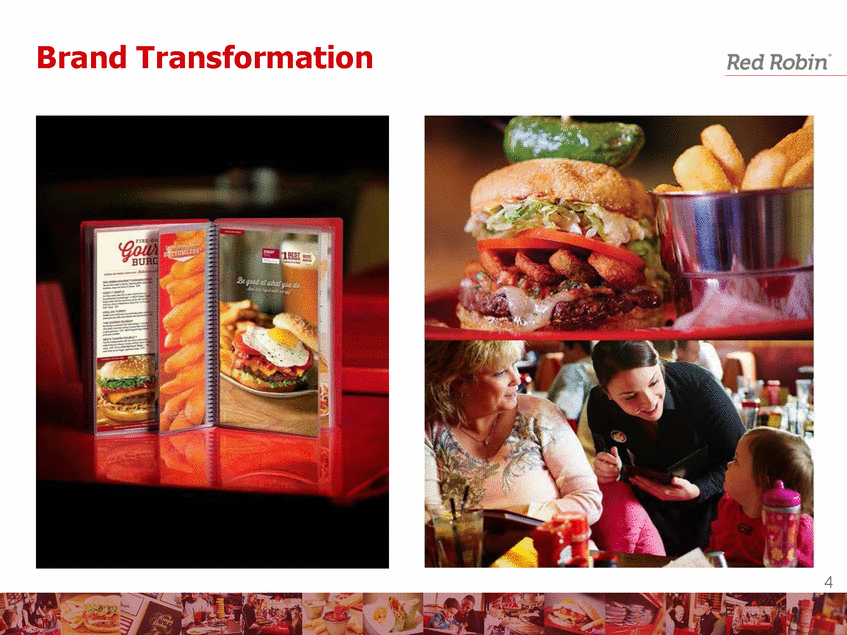
Brand Transformation 4 |
|
|
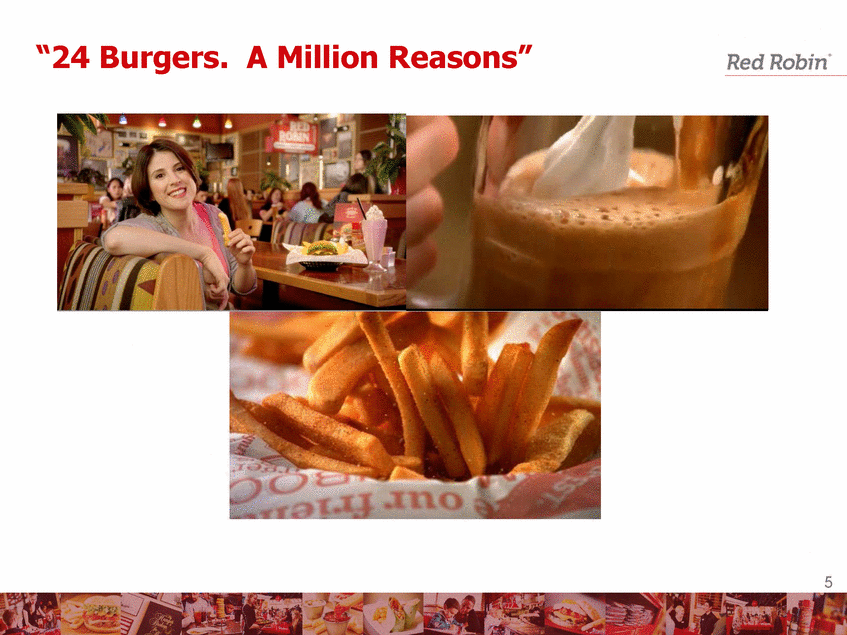
“24 Burgers. A Million Reasons” FPO 5 |
|
|
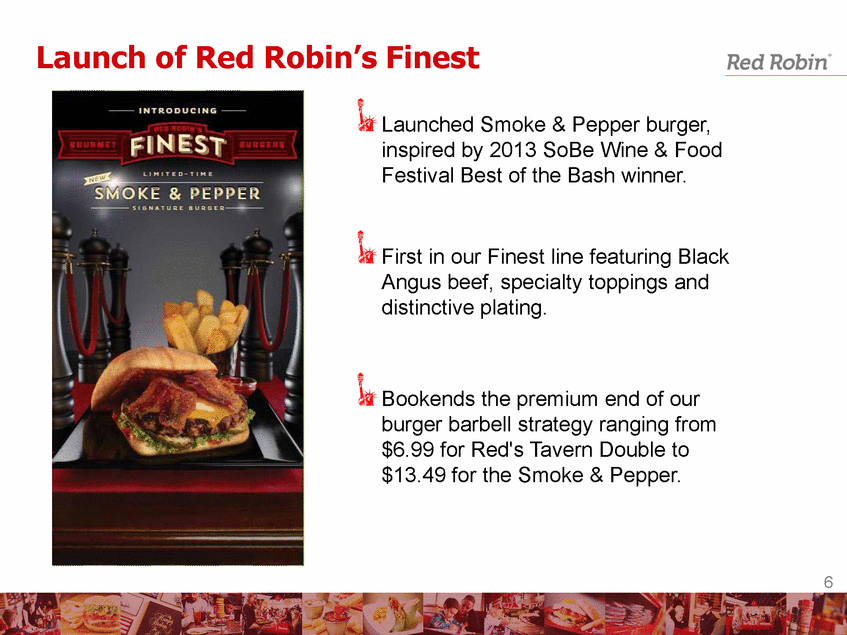
Launch of Red Robin’s Finest 6 Launched Smoke & Pepper burger, inspired by 2013 SoBe Wine & Food Festival Best of the Bash winner. First in our Finest line featuring Black Angus beef, specialty toppings and distinctive plating. Bookends the premium end of our burger barbell strategy ranging from $6.99 for Red's Tavern Double to $13.49 for the Smoke & Pepper. |
|
|
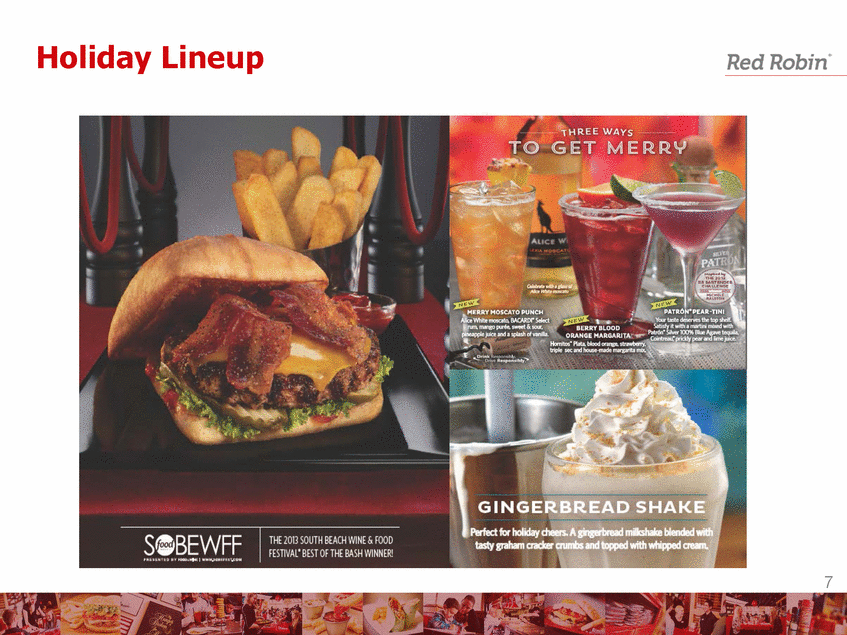
Holiday Lineup 7 |
|
|
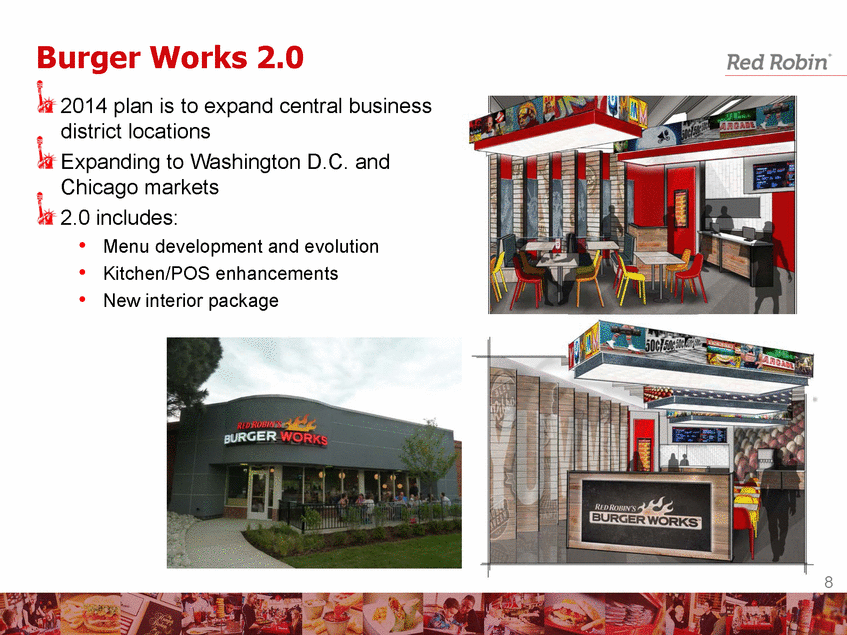
Burger Works 2.0 8 2014 plan is to expand central business district locations Expanding to Washington D.C. and Chicago markets 2.0 includes: • Menu development and evolution • Kitchen/POS enhancements • New interior package |
|
|
Financial Update |
|
|
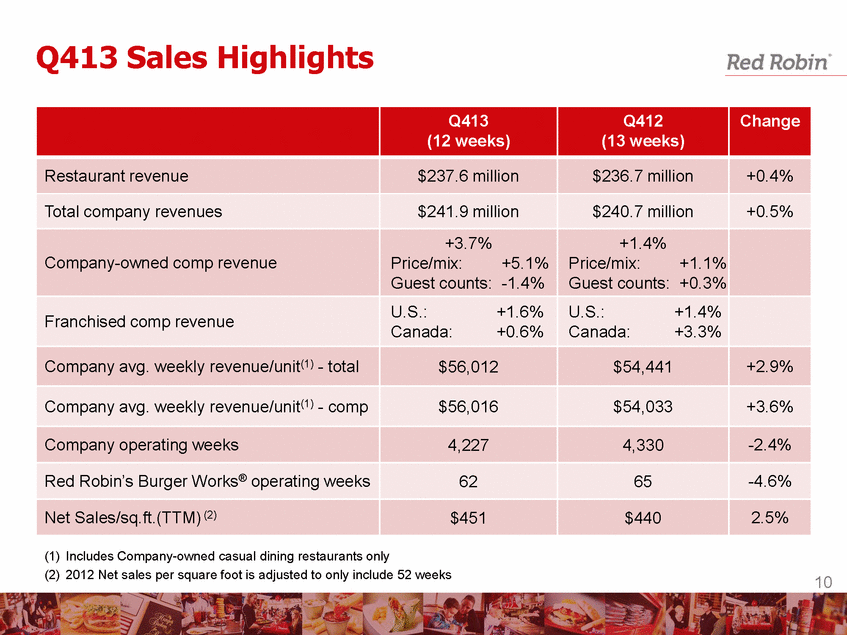
Q413 Sales Highlights Q413 (12 weeks) Q412 (13 weeks) Change Restaurant revenue $237.6 million $236.7 million +0.4% Total company revenues $241.9 million $240.7 million +0.5% Company-owned comp revenue +3.7% Price/mix: +5.1% Guest counts: -1.4% +1.4% Price/mix: +1.1% Guest counts: +0.3% Franchised comp revenue U.S.: +1.6% Canada: +0.6% U.S.: +1.4% Canada: +3.3% Company avg. weekly revenue/unit(1) - total $56,012 $54,441 +2.9% Company avg. weekly revenue/unit(1) - comp $56,016 $54,033 +3.6% Company operating weeks 4,227 4,330 -2.4% Red Robin’s Burger Works® operating weeks 62 65 -4.6% Net Sales/sq.ft.(TTM) (2) $451 $440 2.5% (1) Includes Company-owned casual dining restaurants only (2) 2012 Net sales per square foot is adjusted to only include 52 weeks 10 |
|
|
Comparable Sales Growth 11 |
|
|
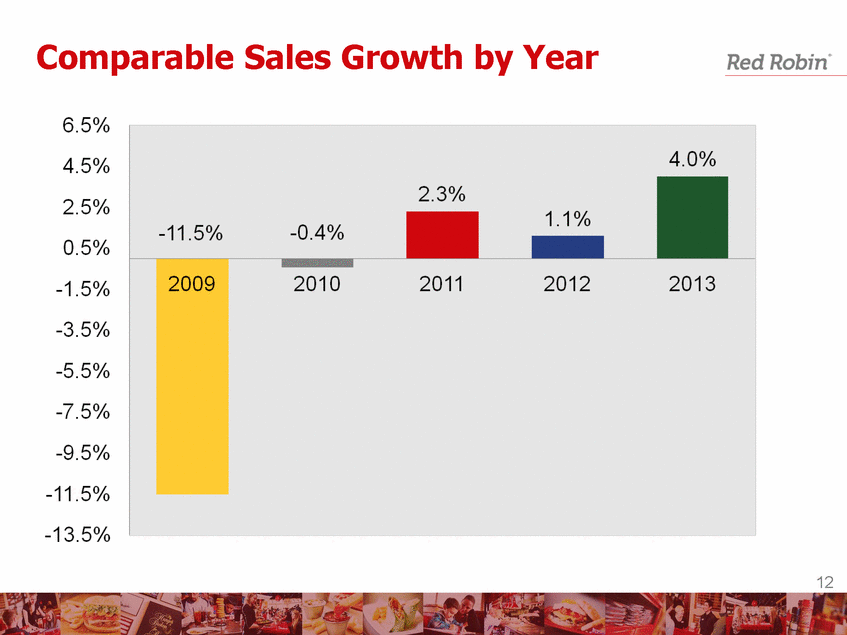
Comparable Sales Growth by Year 12 |
|
|
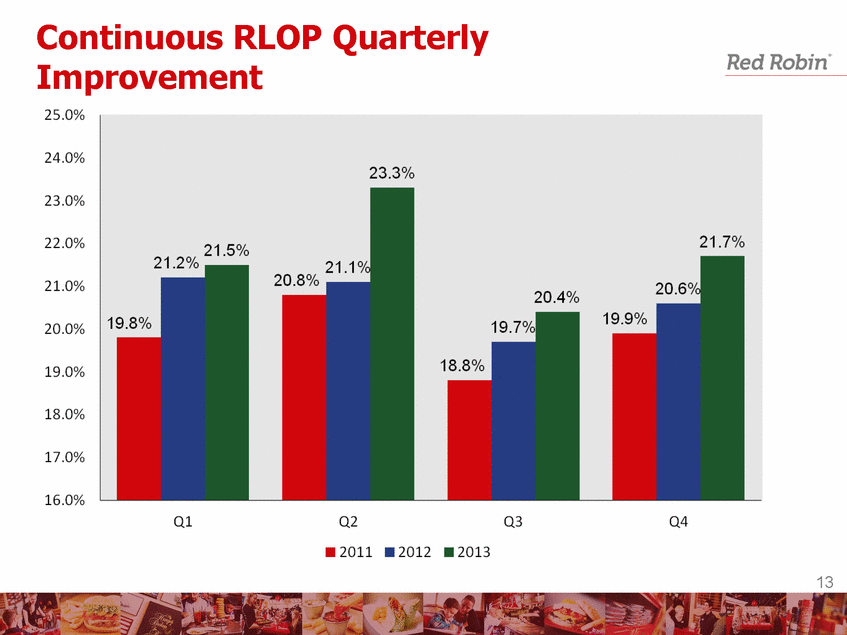
Continuous RLOP Quarterly Improvement 13 |
|
|
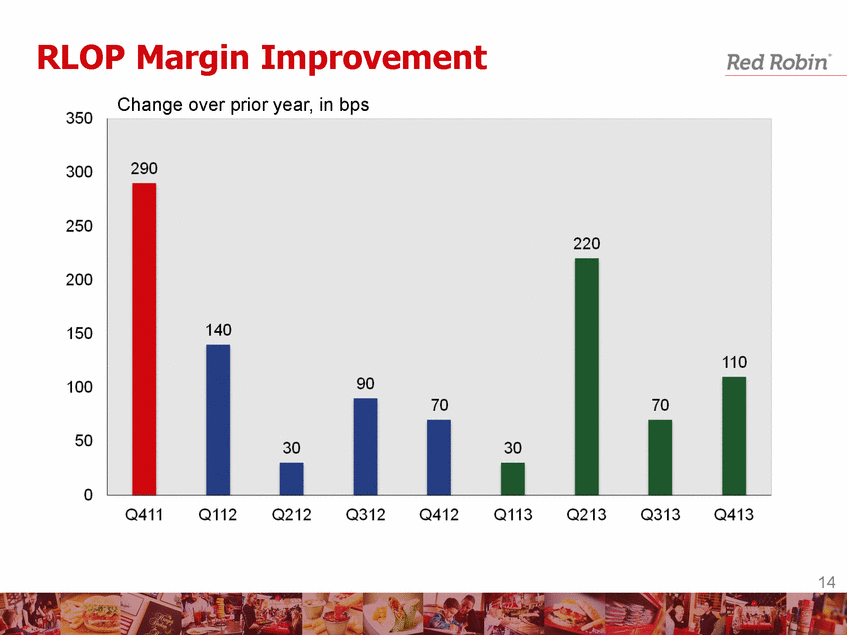
RLOP Margin Improvement Change over prior year, in bps 14 |
|
|
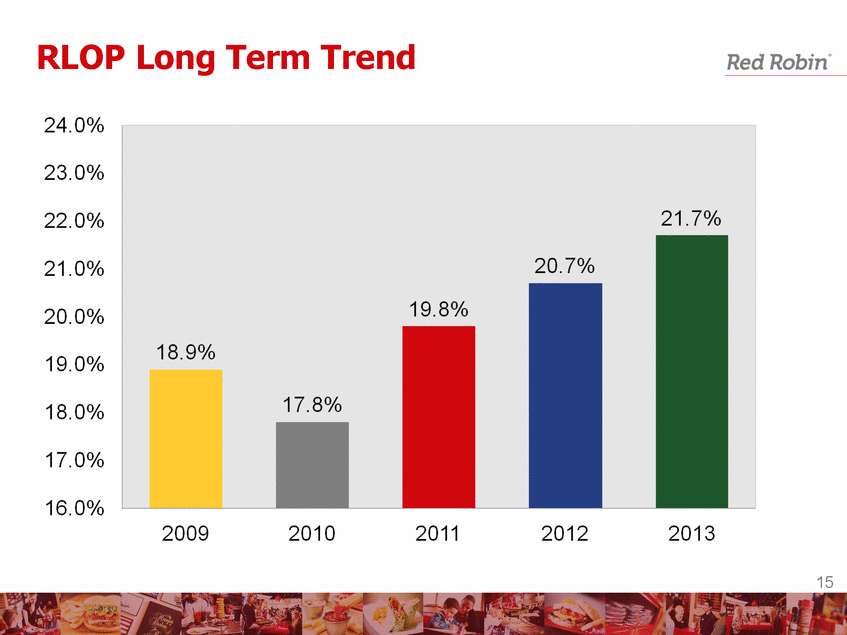
RLOP Long Term Trend 15 |
|
|
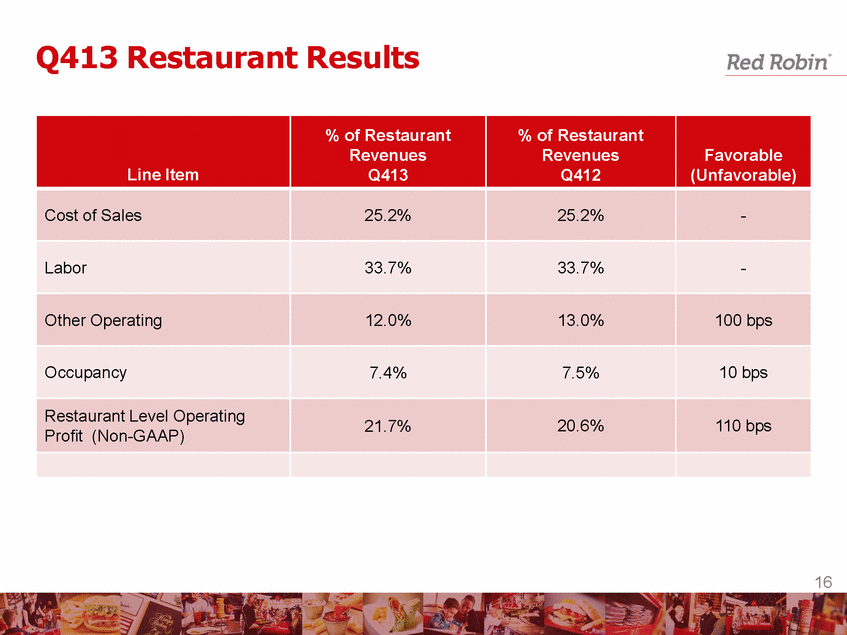
Q413 Restaurant Results Line Item % of Restaurant Revenues Q413 % of Restaurant Revenues Q412 Favorable (Unfavorable) Cost of Sales 25.2% 25.2% - Labor 33.7% 33.7% - Other Operating 12.0% 13.0% 100 bps Occupancy 7.4% 7.5% 10 bps Restaurant Level Operating Profit (Non-GAAP) 21.7% 20.6% 110 bps 16 |
|
|
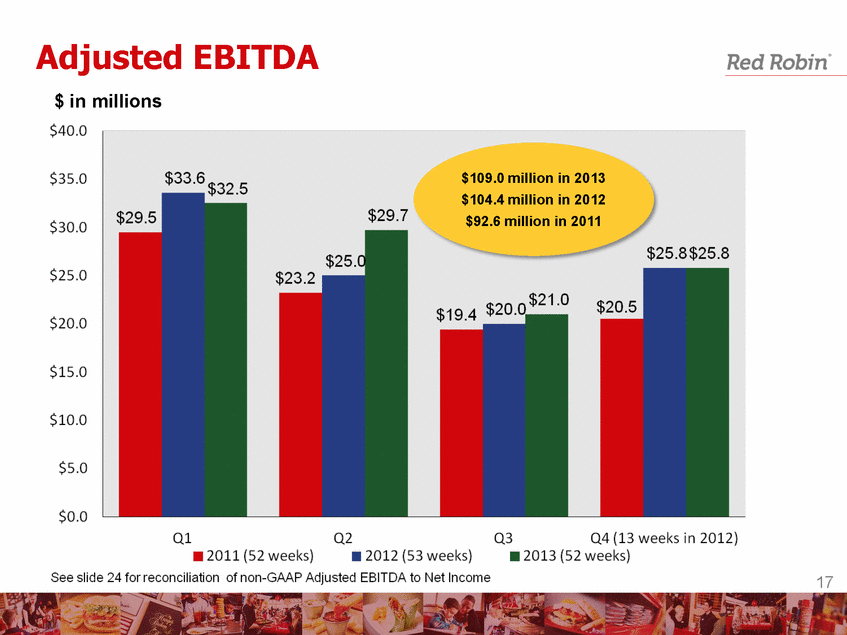
Adjusted EBITDA $ in millions 17 $109.0 million in 2013 $104.4 million in 2012 $92.6 million in 2011 |
|
|
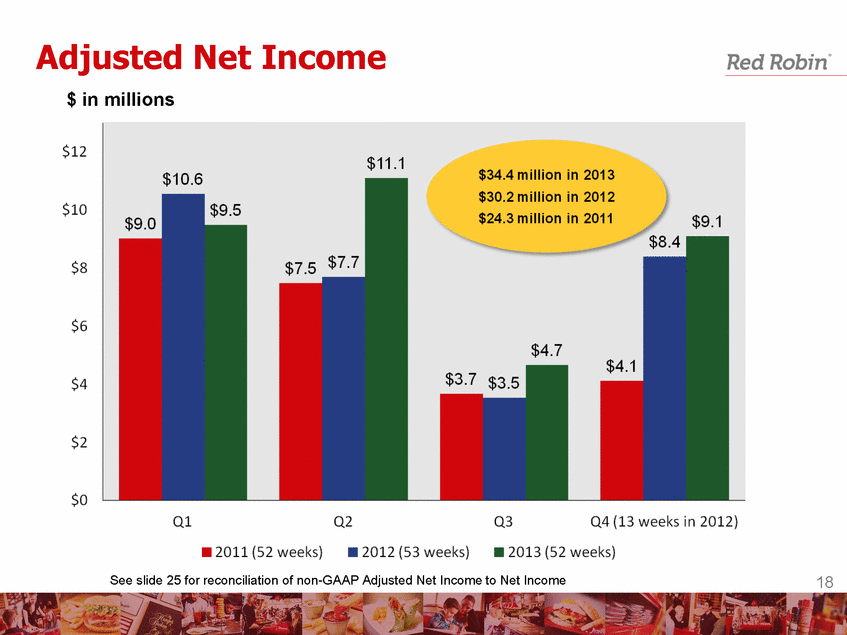
Adjusted Net Income $ in millions 18 See slide 25 for reconciliation of non-GAAP Adjusted Net Income to Net Income |
|
|
Adjusted Earnings Per Diluted Share Note: Fiscal Q4 2012 contained 13 weeks compared to 12 weeks in 2013 and 2011 19 See slide 25 for reconciliation of non-GAAP Adjusted Earnings Per Diluted Share to Earnings Per Diluted share $2.37 in 2013 $2.06 in 2012 $1.58 in 2011 |
|
|
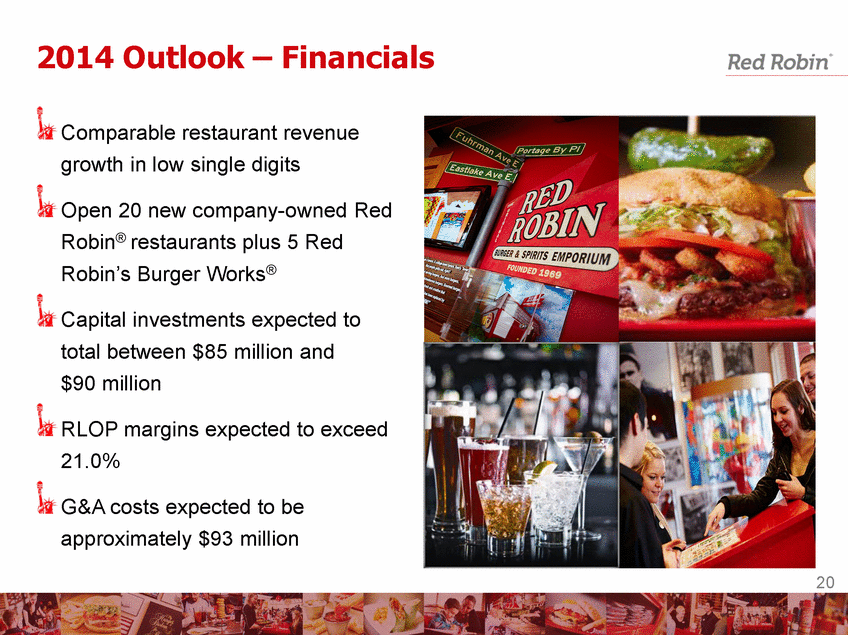
2014 Outlook – Financials Comparable restaurant revenue growth in low single digits Open 20 new company-owned Red Robin® restaurants plus 5 Red Robin’s Burger Works® Capital investments expected to total between $85 million and $90 million RLOP margins expected to exceed 21.0% G&A costs expected to be approximately $93 million 20 |
|
|
Appendix |
|
|
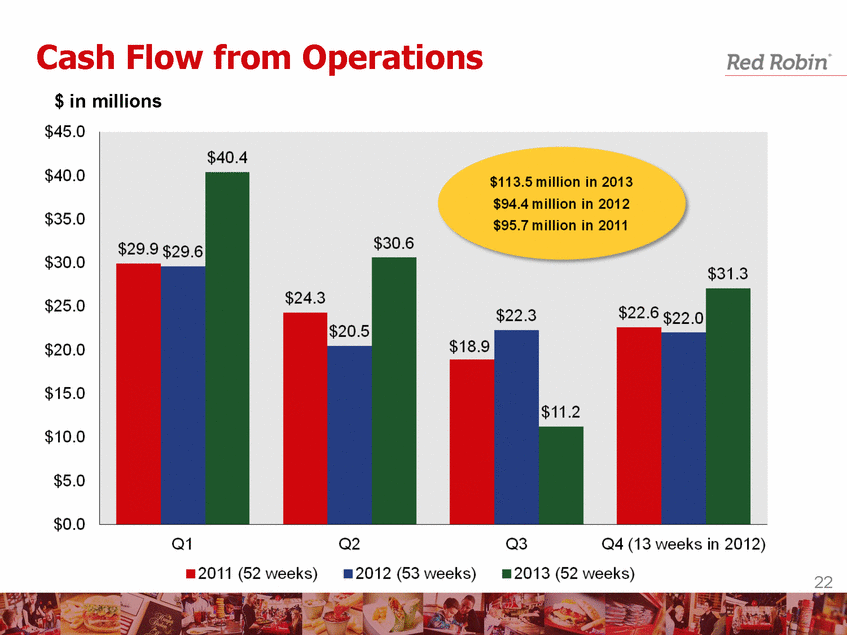
Cash Flow from Operations $ in millions 22 |
|
|
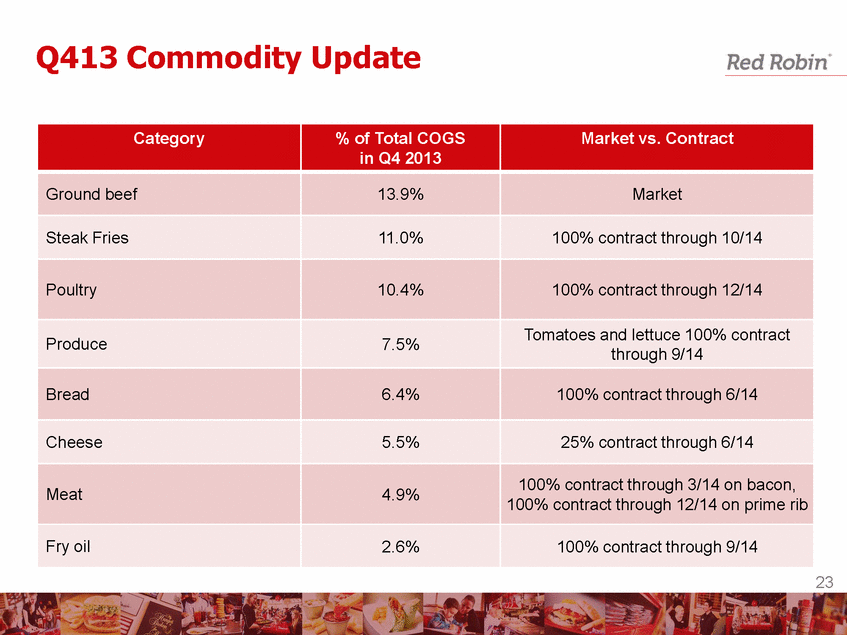
Q413 Commodity Update Category % of Total COGS in Q4 2013 Market vs. Contract Ground beef 13.9% Market Steak Fries 11.0% 100% contract through 10/14 Poultry 10.4% 100% contract through 12/14 Produce 7.5% Tomatoes and lettuce 100% contract through 9/14 Bread 6.4% 100% contract through 6/14 Cheese 5.5% 25% contract through 6/14 Meat 4.9% 100% contract through 3/14 on bacon, 100% contract through 12/14 on prime rib Fry oil 2.6% 100% contract through 9/14 23 |
|
|
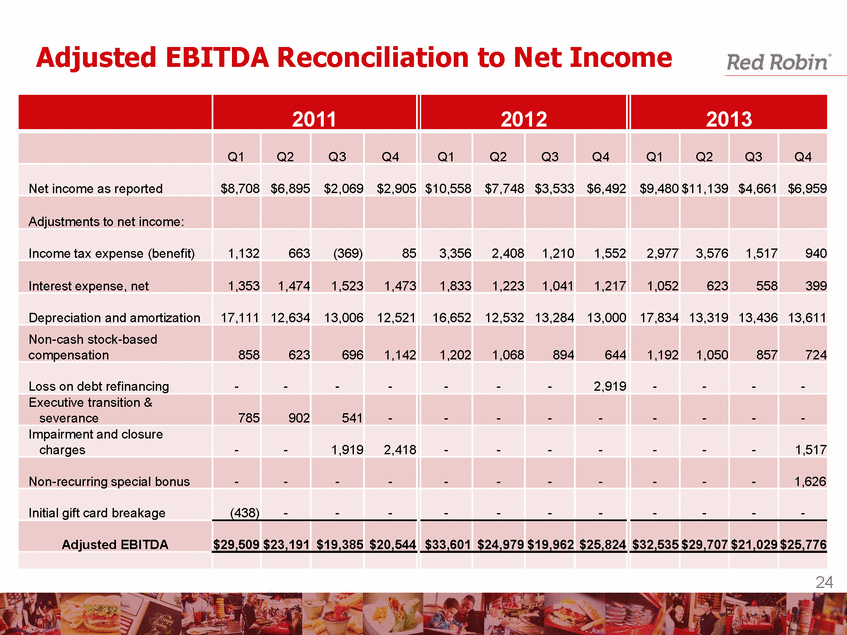
Adjusted EBITDA Reconciliation to Net Income 2011 2012 2013 Q1 Q2 Q3 Q4 Q1 Q2 Q3 Q4 Q1 Q2 Q3 Q4 Net income as reported $8,708 $6,895 $2,069 $2,905 $10,558 $7,748 $3,533 $6,492 $9,480 $11,139 $4,661 $6,959 Adjustments to net income: Income tax expense (benefit) 1,132 663 (369) 85 3,356 2,408 1,210 1,552 2,977 3,576 1,517 940 Interest expense, net 1,353 1,474 1,523 1,473 1,833 1,223 1,041 1,217 1,052 623 558 399 Depreciation and amortization 17,111 12,634 13,006 12,521 16,652 12,532 13,284 13,000 17,834 13,319 13,436 13,611 Non-cash stock-based compensation 858 623 696 1,142 1,202 1,068 894 644 1,192 1,050 857 724 Loss on debt refinancing - - - - - - - 2,919 - - - - Executive transition & severance 785 902 541 - - - - - - - - - Impairment and closure charges - - 1,919 2,418 - - - - - - - 1,517 Non-recurring special bonus - - - - - - - - - - - 1,626 Initial gift card breakage (438) - - - - - - - - - - - Adjusted EBITDA $29,509 $23,191 $19,385 $20,544 $33,601 $24,979 $19,962 $25,824 $32,535 $29,707 $21,029 $25,776 24 |
|
|
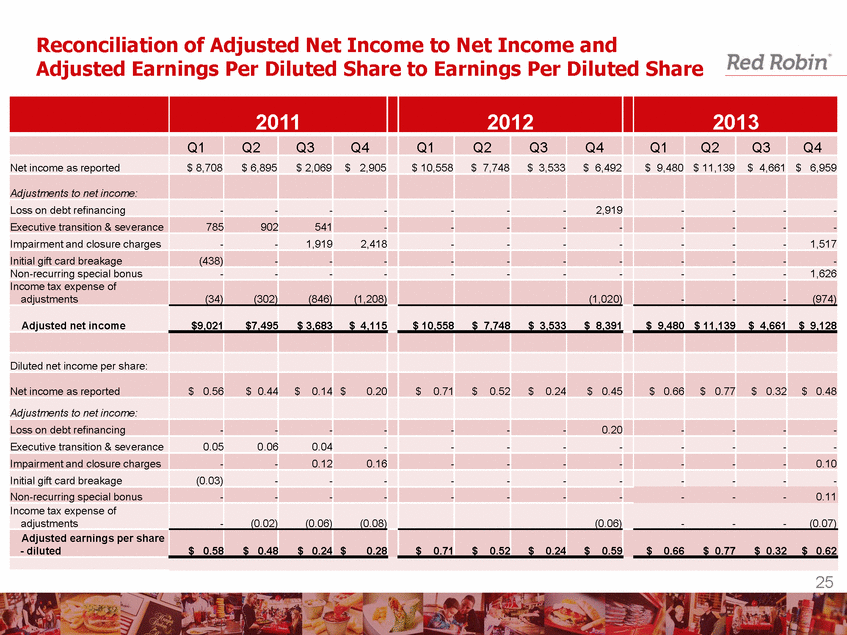
Reconciliation of Adjusted Net Income to Net Income and Adjusted Earnings Per Diluted Share to Earnings Per Diluted Share 2011 2012 2013 Q1 Q2 Q3 Q4 Q1 Q2 Q3 Q4 Q1 Q2 Q3 Q4 Net income as reported $ 8,708 $ 6,895 $ 2,069 $ 2,905 $ 10,558 $ 7,748 $ 3,533 $ 6,492 $ 9,480 $ 11,139 $ 4,661 $ 6,959 Adjustments to net income: Loss on debt refinancing - - - - - - - 2,919 - - - - Executive transition & severance 785 902 541 - - - - - - - - - Impairment and closure charges - - 1,919 2,418 - - - - - - - 1,517 Initial gift card breakage (438) - - - - - - - - - - - Non-recurring special bonus - - - - - - - - - - - 1,626 Income tax expense of adjustments (34) (302) (846) (1,208) (1,020) - - - (974) Adjusted net income $9,021 $7,495 $ 3,683 $ 4,115 $ 10,558 $ 7,748 $ 3,533 $ 8,391 $ 9,480 $ 11,139 $ 4,661 $ 9,128 Diluted net income per share: Net income as reported $ 0.56 $ 0.44 $ 0.14 $ 0.20 $ 0.71 $ 0.52 $ 0.24 $ 0.45 $ 0.66 $ 0.77 $ 0.32 $ 0.48 Adjustments to net income: Loss on debt refinancing - - - - - - - 0.20 - - - - Executive transition & severance 0.05 0.06 0.04 - - - - - - - - - Impairment and closure charges - - 0.12 0.16 - - - - - - - 0.10 Initial gift card breakage (0.03) - - - - - - - - - - - Non-recurring special bonus - - - - - - - - - - - 0.11 Income tax expense of adjustments - (0.02) (0.06) (0.08) (0.06) - - - (0.07) Adjusted earnings per share - diluted $ 0.58 $ 0.48 $ 0.24 $ 0.28 $ 0.71 $ 0.52 $ 0.24 $ 0.59 $ 0.66 $ 0.77 $ 0.32 $ 0.62 25 |