As filed with the Securities and Exchange Commission on November 7, 2003
Registration No. 333-110209
SECURITIES AND EXCHANGE COMMISSION
Amendment No. 1
to
FORM S-3
REGISTRATION STATEMENT
UNDER
THE SECURITIES ACT OF 1933
RED ROBIN GOURMET BURGERS, INC.
(Exact name of registrant as specified in its charter)
| Delaware | 5812 | 84-1573084 | ||
| (State or other jurisdiction of incorporation or organization) |
(Primary standard industrial classification code number) |
(I.R.S. Employer Identification No.) |
5575 DTC Parkway, Suite 110
Greenwood Village, Colorado 80111
(303) 846-6000
(Address, including zip code, and telephone number, including area code, of registrant’s principal executive offices)
Michael J. Snyder
Chief Executive Officer
Red Robin Gourmet Burgers, Inc.
5575 DTC Parkway, Suite 110
Greenwood Village, Colorado 80111
(303) 846-6000
(Name, Address, including zip code, and telephone number, including area code, of agent for service)
Copies to:
| Thomas J. Leary Brandi R. Steege O’Melveny & Myers LLP 610 Newport Center Drive, Suite 1700 Newport Beach, California 92660 (949) 760-9600 |
Valerie Ford Jacob Stuart H. Gelfond Fried, Frank, Harris, Shriver & Jacobson One New York Plaza New York, New York 10004 (212) 859-8000 |
Approximate date of commencement of proposed sale to public: as soon as practicable after the registration statement becomes effective.
If the only securities being registered on this form are being offered pursuant to dividend or interest reinvestment plans, please check the following box. ¨
If any of the securities being registered on this form are to be offered on a delayed or continuous basis pursuant to Rule 415 under the Securities Act of 1933, other than securities offered only in connection with dividend or interest reinvestment plans, check the following box. ¨
If this form is filed to register additional securities for an offering pursuant to Rule 462(b) under the Securities Act, please check the following box and list the Securities Act registration statement number of the earliest effective registration statement for the same offering. ¨
If this form is a post-effective amendment filed pursuant to Rule 462(c) under the Securities Act, check the following box and list the Securities Act registration statement number of the earlier effective registration statement for the same offering. ¨
If delivery of the prospectus is expected to be made pursuant to Rule 434, please check the following box. ¨
CALCULATION OF REGISTRATION FEE
| Title of Each Class of Securities to be Registered |
Amount to be Registered(1) |
Proposed Offering Price |
Proposed Maximum Aggregate Offering Price(2) |
Amount of Registration Fee(3) | |||||||
| Common Stock, par value $0.001 per share |
3,977,474 | $ | 27.84 | $ | 110,732,876 | $ | 8,958 | ||||
| (1) | Includes shares that the underwriters have the option to purchase solely to cover over allotments, if any. |
| (2) | Estimated solely for the purpose of determining the registration fee pursuant to Rule 457(c) promulgated under the Securities Act of 1933, as amended, based upon the average of the high and low prices reported on the Nasdaq National Market on October 28, 2003. |
| (3) | Registration fees were previously paid. |
The registrant hereby amends this registration statement on such date or dates as may be necessary to delay its effective date until the registrant shall file a further amendment which specifically states that this registration statement shall thereafter become effective in accordance with Section 8(a) of the Securities Act of 1933 or until the registration statement shall become effective on such date as the Commission acting pursuant to said Section 8(a), may determine.
The information in this prospectus is not complete and may be changed. Red Robin may not sell these securities until the registration statement filed with the Securities and Exchange Commission is effective. This prospectus is not an offer to sell these securities and Red Robin is not soliciting an offer to buy these securities in any state where the offer or sale is not permitted.
SUBJECT TO COMPLETION, DATED NOVEMBER 7, 2003
PROSPECTUS
3,458,673 Shares
Common Stock
Red Robin Gourmet Burgers, Inc., and the selling stockholders are offering shares of common stock in a firmly underwritten offering. Red Robin is offering 750,000 shares and the selling stockholders are offering 2,708,673 shares. Red Robin will not receive any of the proceeds from shares sold by the selling stockholders.
Our common stock is traded on the Nasdaq National Market under the symbol “RRGB.” The last reported sale price of our common stock on the Nasdaq National Market on November 5, 2003 was $28.75 per share.
Investing in our common stock involves risks. See “Risk Factors” beginning on page 7 of this prospectus.
| Per Share |
Total | |||||
| Offering Price |
$ | $ | ||||
| Discounts and Commissions to Underwriters |
$ | $ | ||||
| Offering Proceeds to Red Robin |
$ | $ | ||||
| Offering Proceeds to the Selling Stockholders |
$ | $ | ||||
Neither the Securities and Exchange Commission nor any state securities commission has approved or disapproved of these securities or determined if this prospectus is truthful or complete. Any representation to the contrary is a criminal offense.
Some of the selling stockholders have granted the underwriters the right to purchase up to an additional 518,801 shares of common stock to cover any over-allotments. The underwriters can exercise this right at any time from time to time within 30 days after the offering. Delivery of the shares of common stock will be made on or about , 2003
Banc of America Securities LLC Wachovia Securities
U.S. Bancorp Piper Jaffray SunTrust Robinson Humphrey
McDonald Investments Inc. Harris Nesbitt Gerard
The date of this prospectus is , 2003.
| Page | ||
| i | ||
| 1 | ||
| 7 | ||
| 16 | ||
| 17 | ||
| 17 | ||
| 17 | ||
| 18 | ||
| 19 | ||
| Management’s Discussion and Analysis of Financial Condition and Results of Operations |
21 | |
| 40 | ||
| 53 | ||
| 56 | ||
| 60 | ||
| 62 | ||
| 64 | ||
| 65 | ||
| 69 | ||
| 72 | ||
| 72 | ||
| 73 | ||
| F-1 |
You should rely only on the information contained in this prospectus. We have not authorized anyone to provide you with information that is different. We are offering to sell and seeking offers to buy shares of our common stock only in jurisdictions where offers or sales are permitted. The information in this document may only be accurate on the date of this document. Our business, financial condition or results of operations may have changed since that date.
Red Robin®, America’s Gourmet Burgers & Spirits® and Mad Mixology® are federally registered trademarks and service marks owned by Red Robin. Red Robin® is also registered in Canada. This prospectus also contains trademarks of companies other than Red Robin and use of these marks in this prospectus does not indicate an affiliation with or endorsement by these third parties.
ASSUMPTIONS USED IN THIS PROSPECTUS
Throughout this prospectus, our fiscal years ended December 27, 1998, December 26, 1999, December 31, 2000, December 30, 2001 and December 29, 2002 are referred to as years 1998, 1999, 2000, 2001 and 2002, respectively. Our fiscal years ending December 28, 2003 and December 26, 2004 are referred to as 2003 and 2004, respectively. Our fiscal year consists of 52 or 53 weeks and ends on the last Sunday in December in each fiscal year. Fiscal year 2000 included 53 weeks. All other fiscal years shown include 52 weeks. Together, the sum of our first, second and third quarters of 2002 and 2003 are referred to throughout this prospectus as the forty weeks ended October 6, 2002 and October 5, 2003, respectively. Our first quarters include 16 weeks and our second, third and fourth quarters each include 12 weeks, except for 53-week fiscal years in which our fourth quarters include 13 weeks.
i
During first quarter 2003, we changed our method of calculating company-owned comparable restaurant sales. Under our new method, restaurants become comparable in the first period following five full quarters of operations. Prior to this change, our restaurants became comparable in the first period following the first full fiscal year of operations. Throughout this prospectus, we present company-owned comparable restaurant sales using the new method for all periods presented.
Unless we indicate otherwise, all of the information in this prospectus assumes:
| • | the underwriters will not exercise their over-allotment option to purchase up to 518,801 additional shares of our common stock from some of the selling stockholders at the price set forth on the cover of this prospectus; |
| • | an assumed offering price of $28.75; and |
| • | no exercise of options to purchase 1,258,986 shares of our common stock reserved for issuance under our stock option plans, of which an aggregate of 780,269 shares of common stock were outstanding as of October 5, 2003, and no issuance of shares related to the 290,738 shares of common stock reserved for future issuance under our employee stock purchase plan. |
ii
You should read this summary together with the more detailed information regarding Red Robin and the common stock being sold in this offering and the consolidated financial statements and the related notes appearing elsewhere in this prospectus. This summary is not complete and does not contain all of the information you should consider before investing in our common stock. You should read the entire prospectus carefully, including the “Risk Factors” section and our consolidated financial statements and the related notes. References in this prospectus to “Red Robin,” “company,” “we,” “us” and “our” refer to the business of Red Robin Gourmet Burgers, Inc. and its subsidiaries.
OUR BUSINESS
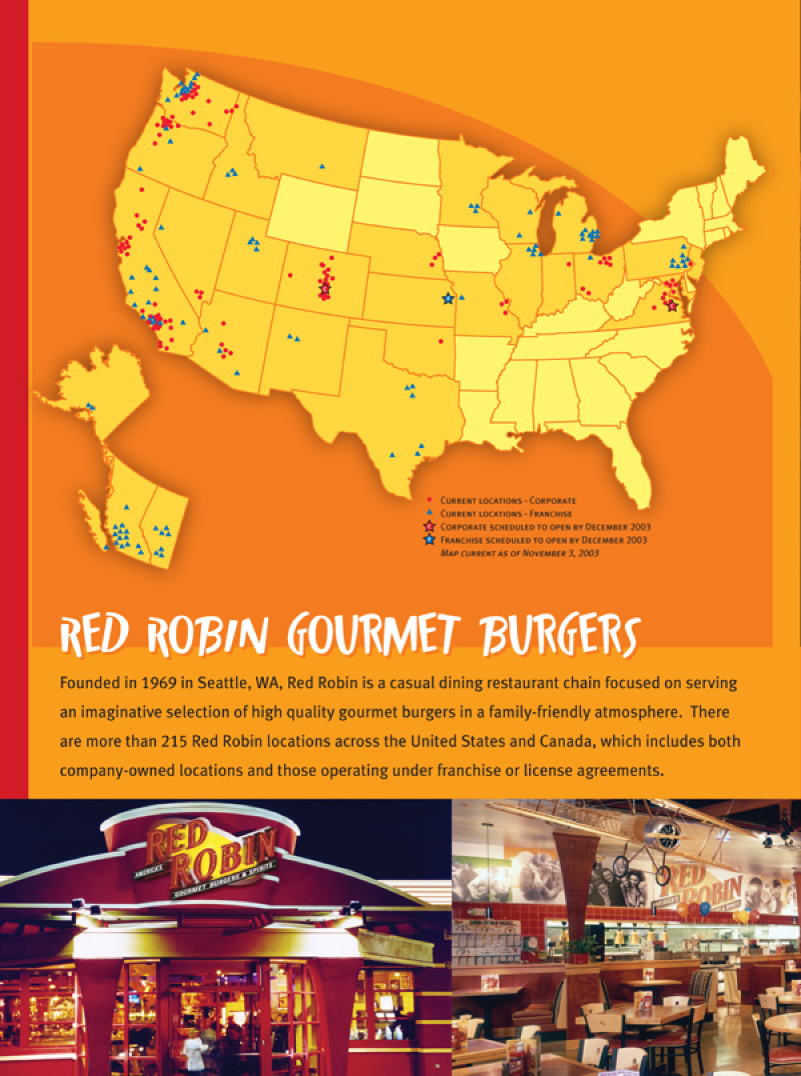
Red Robin is a casual dining restaurant chain focused on serving an imaginative selection of high quality gourmet burgers in a family-friendly atmosphere. We currently own and operate 113 restaurants in 14 states, and have 103 additional restaurants operating under franchise or license agreements in 18 states and Canada.
Our menu is centered around our signature product, the gourmet burger, which we make from beef, chicken, veggie, fish, turkey and pot roast and serve in a variety of recipes. We offer a wide selection of toppings for our gourmet burgers, including fresh guacamole, roasted green chilies, honey mustard dressing, grilled pineapple, crispy onion straws, sautéed mushrooms and a choice of six different cheeses. In addition to our gourmet burgers, which accounted for approximately 44.2% of our total food sales in 2002, we also serve an array of other food items that are designed to appeal to a broad group of guests, including salads, soups, appetizers, other entrees such as rice bowls and pasta, desserts and our signature Mad Mixology® alcoholic and non-alcoholic specialty beverages.
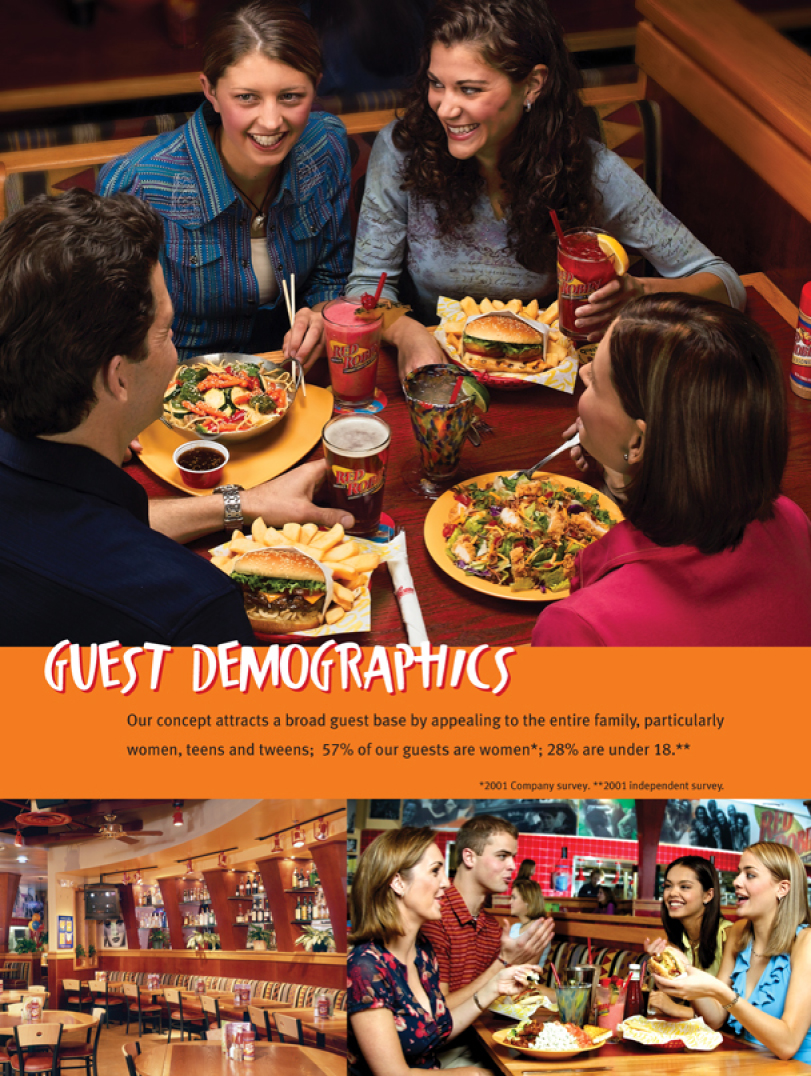
Our restaurants are designed to create a fun and memorable dining experience in a family-friendly atmosphere and to provide our guests with an exceptional dining value. Our concept attracts a broad guest base by appealing to the entire family.
OUR CONCEPT AND BUSINESS STRATEGY
Our objective is to be the leading gourmet burger and casual dining restaurant destination. To achieve our objective, we have developed the following strategies.
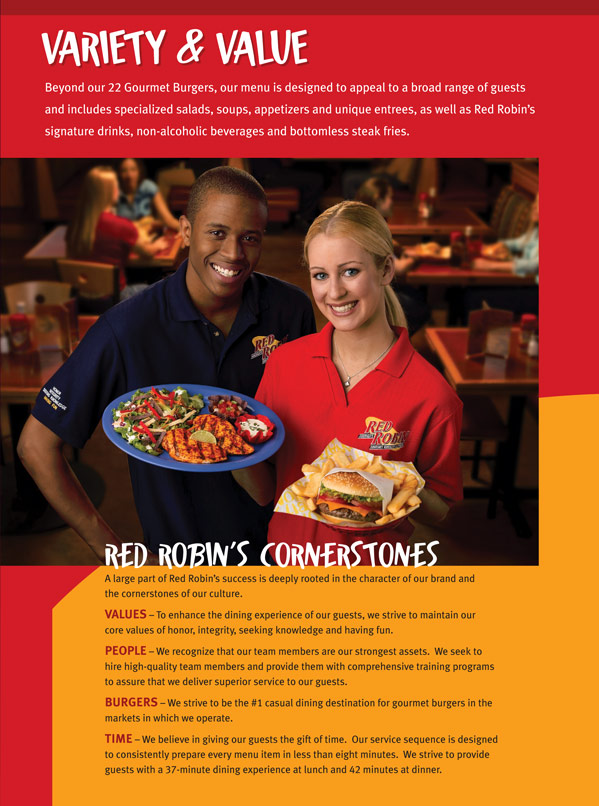
| • | Focus on our key guiding principals, or “cornerstones,” that drive our success. Values, people, burgers and time. |
| • | Offer high quality, imaginative menu items. Our restaurants feature imaginative menu items that showcase recipes and capture tastes and flavors that our guests do not typically associate with burgers, salads and sandwiches. |
| • | Create a fun, festive and memorable dining experience. We promote an exciting, high-energy and family-friendly atmosphere by decorating our restaurant interiors with an eclectic selection of celebrity posters, three-dimensional artwork, carousel horses and statues of our mascot “Red.” |
| • | Provide an exceptional dining value with broad consumer appeal. We offer generous portions of high quality, imaginative food and beverages for a per person average check of approximately $10.00, including beverages, which we believe differentiates us from many of our competitors who have significantly higher average guest checks. |
| • | Deliver strong unit economics. In 2002, our comparable company-owned restaurants generated average sales of approximately $3.0 million. The average cash investment cost for our free-standing restaurants opened in 2002 was approximately $1.7 million, excluding pre-opening costs, which averaged approximately $181,000 per restaurant, and land. |
1
| • | Pursue disciplined restaurant and franchise growth. Our disciplined expansion strategy includes both company-owned and franchised development. In 2002, we opened ten new company-owned restaurants and relocated one restaurant, and our franchisees opened five new restaurants. We have opened 16 new company-owned restaurants in the current year and we intend to open an additional two company-owned restaurants during the remainder of the year, for a total of 18 new restaurants for 2003. We also assumed operations of an existing franchise restaurant during the first quarter of 2003. Nine new franchise restaurants have opened in the current year and we believe our franchisees will open one additional restaurant during the remainder of the year, for a total of ten new franchise restaurants for 2003. For 2004, we expect to open 20 to 22 new company-owned restaurants and we believe our franchisees will open 14 to 16 new restaurants. |
| • | Build awareness of the Red Robin® America’s Gourmet Burgers & Spirits® brand. We believe we have become well known within our markets for our signature menu items and we intend to strengthen this brand loyalty by continuing to offer new menu items and deliver a consistently memorable guest experience. |
| • | Continue to capitalize on favorable lifestyle and demographic trends. We believe we have benefited from several key trends that have helped drive our business. These trends include the expected increase in consumption of food away from home and the large and growing teen population. |
OUR GROWTH STRATEGIES
We believe that there are significant opportunities to grow our concept and brand on a nationwide basis through both new company-owned and franchised restaurants. We believe that our concept and brand can support more than 830 additional company-owned or franchised restaurants throughout the United States.
Company-owned restaurants. Our primary source of expansion and growth in the near term will be the addition of new company-owned restaurants. We are pursuing a disciplined growth strategy and intend to develop many of our new restaurants in our existing markets, and selectively enter into new markets. Part of our growth strategy is to cluster restaurants within existing markets, which we believe will enable us to gain operating efficiencies, increase brand awareness and enhance convenience and ease of access for our guests, all of which we believe will lead to significant repeat business. Our site selection criteria for new restaurants is flexible and allows us to adapt to a variety of locations near high activity areas such as retail centers, big box shopping centers and entertainment centers.
Franchised Restaurants. The other key aspect of our growth strategy is the continued development of our franchise restaurants. We expect the majority of our new franchise restaurant growth to occur primarily in the Northeast, Midwest and the South. We intend to continue to strengthen our franchise system by attracting experienced and well-capitalized area developers who are quality-conscious restaurant operators and who possess the expertise and resources to execute the development of new restaurants on a large scale.
RISK FACTORS
An investment in our common stock involves a high degree of risk. The following risks, as well as the risks discussed in “Risk Factors,” should be carefully considered before investing in our common stock:
| • | our ability to open new restaurants, secure sufficient new space and manage our planned expansion; |
| • | the continued service of key management personnel; |
| • | changes in consumer preferences or consumer discretionary spending; |
2
| • | health concerns regarding beef or other food products; |
| • | the effect of competition in the restaurant industry; |
| • | changes in the availability and cost of food; |
| • | the ability of our franchisees to take actions that could harm our business; |
| • | adverse economic and other developments in the Western United States where 77.0% of our company-owned restaurants are located; and |
| • | Quad-C, Mike Snyder and our other officers, directors and principal stockholders will hold approximately 32.2% of our common stock after this offering and, acting individually or together, will be able to exert significant influence over all matters requiring stockholder approval, including the election of directors and significant business transactions. |
Our principal executive offices are located at 5575 DTC Parkway, Suite 110, Greenwood Village, CO 80111, and our telephone number is (303) 846-6000. Our website is located at www.redrobin.com. Information contained on our website is not incorporated by reference herein and our web address is included as an inactive textual reference only.
3
THE OFFERING
| Common stock offered by: |
||
| Red Robin Gourmet Burgers, Inc. |
750,000 shares | |
| Selling stockholders |
2,708,673 shares | |
| Common stock to be outstanding after this offering(1) |
15,956,074 shares | |
| Use of proceeds |
We intend to use the proceeds of this offering to repay approximately $19.7 million of indebtedness under our revolving credit facility, and the remaining proceeds, if any, will be used for general corporate purposes, including opening new restaurants and the acquisition of existing restaurants from franchisees. Any proceeds used to repay borrowings under our revolving credit facility will result in an increase in the amount of future borrowings available to us, subject to the terms of our revolving credit agreement. | |
| We will not receive any of the proceeds from the sale of shares by the selling stockholders. See “Use of Proceeds.” | ||
| Nasdaq National Market symbol |
RRGB | |
| (1) | The number of shares of common stock to be outstanding after this offering is based on our shares outstanding as of October 5, 2003. This information excludes: |
| • | 1,258,986 shares of our common stock reserved for issuance under our stock option plans, of which 780,269 shares are subject to options outstanding at a weighted-average exercise price of $11.68 per share; and |
| • | 290,738 shares of common stock reserved for future issuance under our employee stock purchase plan. |
4
SUMMARY CONSOLIDATED FINANCIAL AND OPERATING DATA
| Fiscal Year Ended |
Forty Weeks Ended |
|||||||||||||||||||
| 2000 |
2001 |
2002 |
October 6, 2002 |
October 5, 2003 |
||||||||||||||||
| (in thousands, except per share data, restaurant-related data and footnotes) |
||||||||||||||||||||
| (Unaudited) | ||||||||||||||||||||
| Statement of Income Data(1): |
||||||||||||||||||||
| Revenue: |
||||||||||||||||||||
| Restaurant |
$ | 180,414 | $ | 214,963 | $ | 265,518 | $ | 201,878 | $ | 240,468 | ||||||||||
| Franchise royalties and fees |
8,247 | 9,002 | 8,565 | 6,683 | 6,967 | |||||||||||||||
| Rent revenue |
509 | 520 | 327 | 282 | 369 | |||||||||||||||
| Total revenues |
189,170 | 224,485 | 274,410 | 208,843 | 247,804 | |||||||||||||||
| Income from operations |
8,633 | 18,740 | 22,157 | 17,585 | 19,643 | |||||||||||||||
| Interest expense |
6,482 | 7,850 | 5,769 | 4,857 | 2,331 | |||||||||||||||
| Interest income |
(742 | ) | (746 | ) | (398 | ) | (205 | ) | (256 | ) | ||||||||||
| Loss on extinguishment of debt |
— | — | 4,336 | 4,272 | 257 | |||||||||||||||
| Other expense |
19 | 190 | 105 | 62 | 19 | |||||||||||||||
| (Provision) benefit for income taxes(2) |
12,557 | (3,722 | ) | (4,081 | ) | (3,002 | ) | (5,751 | ) | |||||||||||
| Net income(2) |
$ | 15,431 | $ | 7,724 | $ | 8,264 | $ | 5,597 | $ | 11,541 | ||||||||||
| Net income per common share(2) |
||||||||||||||||||||
| Basic |
$ | 2.07 | $ | 0.77 | $ | 0.67 | $ | 0.49 | $ | 0.76 | ||||||||||
| Diluted |
$ | 2.07 | $ | 0.75 | $ | 0.65 | $ | 0.47 | $ | 0.75 | ||||||||||
| Shares used in computing net income per common share |
||||||||||||||||||||
| Basic |
7,444 | 10,085 | 12,278 | 11,461 | 15,092 | |||||||||||||||
| Diluted |
7,444 | 10,236 | 12,660 | 11,888 | 15,343 | |||||||||||||||
| Selected Operating Data: |
||||||||||||||||||||
| System-wide restaurants open at end of period |
164 | 182 | 194 | 194 | 211 | |||||||||||||||
| Company-owned restaurants open at end of period |
73 | 77 | 96 | 95 | 110 | |||||||||||||||
| Average annual comparable company-owned restaurant sales(3) |
$ | 2,896 | $ | 3,066 | $ | 2,982 | ||||||||||||||
| Comparable company-owned restaurant sales increase(3) |
7.1 | % | 1.8 | % | 1.8 | % | 1.6 | % | 3.7 | % | ||||||||||
| Restaurant-level operating profit %(4) |
18.0 | % | 19.2 | % | 19.5 | % | 19.1 | % | 19.2 | % | ||||||||||
| Income from operations %(5) |
4.6 | % | 8.3 | % | 8.1 | % | 8.4 | % | 7.9 | % | ||||||||||
| Cash Flow Data: |
||||||||||||||||||||
| Net cash provided by operating activities |
$ | 8,184 | $ | 25,762 | $ | 29,114 | $ | 18,151 | $ | 31,597 | ||||||||||
5
| October 5, 2003 |
As | |||||||||||
| Actual |
Adjusted(6) | |||||||||||
| (unaudited) | ||||||||||||
| Balance Sheet Data: |
||||||||||||
| Cash and cash equivalents |
$ | 3,222 | $ | 3,222 | ||||||||
| Total assets |
202,460 | 202,460 | ||||||||||
| Long-term debt, including current portion |
51,543 | 31,863 | ||||||||||
| Total stockholders’ equity |
$ | 111,344 | $ | 131,024 | ||||||||
| (1) | We ceased amortizing goodwill as of the beginning of 2002 in accordance with Statement of Financial Accounting Standards No. 142, “Goodwill and Other Intangible Assets.” For more detail, see Note 2 of the consolidated financial statements included elsewhere in this prospectus. |
| (2) | Net income in 2000 included a benefit for income taxes of $12.6 million as a result of the reversal of previously recorded deferred tax asset valuation allowance. Due to our improved profitability, the deferred tax asset valuation allowance was reversed because it became more likely than not that the deferred tax asset would be realized in the future. |
| (3) | During the first quarter of 2003, we changed our method of calculating company-owned comparable restaurant sales. Under our new method, restaurants become comparable in the first period following five full quarters of operations. |
| (4) | We define restaurant-level operating profit to be restaurant sales minus restaurant-level operating costs, excluding restaurant closures and impairment costs. It does not include general and administrative costs, depreciation and amortization, franchise development costs and pre-opening costs. We believe that restaurant-level operating profit % is an important measure of financial performance because it is widely regarded in the restaurant industry as an important metric by which to evaluate a company’s restaurant-level operating efficiency and performance. We exclude restaurant closure costs as we believe they do not represent a component of the efficiency of continuing operations. We exclude restaurant impairment costs because, similar to depreciation and amortization, they represent a non-cash charge for our investment in the restaurant and not a component of the efficiency of the restaurant’s operations. Restaurant-level operating profit % is calculated by dividing restaurant-level operating profit by restaurant revenues. The table that follows sets forth our calculation of restaurant-level operating profit and a reconciliation to income from operations and net income, directly comparable measures under generally accepted accounting principles, or GAAP. Restaurant-level operating profit % is not a measurement determined in accordance with GAAP and should not be considered in isolation or as an alternative to income from operations or net income as indicators of financial performance. Restaurant-level operating profit % as presented may not be comparable to other similarly titled measures of other companies. |
| Fiscal Year Ended |
Forty Weeks Ended | |||||||||||||||||
| October 6, 2002 |
October 5, 2003 | |||||||||||||||||
| 2000 |
2001 |
2002 |
||||||||||||||||
| (unaudited) | ||||||||||||||||||
| Restaurant revenues |
$ | 180,414 | $ | 214,963 | $ | 265,518 | $ | 201,878 | $ | 240,468 | ||||||||
| Restaurant Operating Costs: |
||||||||||||||||||
| Cost of sales |
43,945 | 50,914 | 61,084 | 46,689 | 56,452 | |||||||||||||
| Labor |
64,566 | 74,854 | 94,030 | 72,059 | 85,117 | |||||||||||||
| Operating |
27,960 | 33,195 | 40,428 | 30,587 | 36,362 | |||||||||||||
| Occupancy |
11,519 | 14,785 | 18,095 | 13,955 | 16,376 | |||||||||||||
| Restaurant-level operating profit |
32,424 | 41,215 | 51,881 | 38,588 | 46,161 | |||||||||||||
| Add — Other Revenues |
8,756 | 9,522 | 8,892 | 6,965 | 7,336 | |||||||||||||
| Deduct — Other Operating Expenses: |
||||||||||||||||||
| Restaurant closures and impairment |
1,302 | 36 | 1,133 | — | — | |||||||||||||
| Depreciation and amortization |
8,237 | 10,491 | 12,883 | 9,417 | 12,110 | |||||||||||||
| General and administrative |
17,116 | 16,845 | 20,260 | 15,081 | 17,150 | |||||||||||||
| Franchise development |
3,386 | 3,704 | 3,256 | 2,655 | 2,180 | |||||||||||||
| Pre-opening costs |
2,506 | 921 | 1,879 | 1,610 | 2,414 | |||||||||||||
| Gain on lease buy-out |
— | — | (945 | ) | (945 | ) | — | |||||||||||
| Impairment of property held for sale |
— | — | 150 | 150 | — | |||||||||||||
| Total Other Operating Expenses |
32,547 | 31,997 | 38,616 | 27,968 | 33,854 | |||||||||||||
| Income from operations |
8,633 | 18,740 | 22,157 | 17,585 | 19,643 | |||||||||||||
| Deduct — Other expenses |
||||||||||||||||||
| Total other expenses |
5,759 | 7,294 | 9,812 | 8,986 | 2,351 | |||||||||||||
| Provision for income taxes |
(12,557 | ) | 3,722 | 4,081 | 3,002 | 5,751 | ||||||||||||
| Total — Other Operating Expenses |
(6,798 | ) | 11,016 | 13,893 | 11,988 | 8,102 | ||||||||||||
| Net income |
$ | 15,431 | $ | 7,724 | $ | 8,264 | $ | 5,597 | $ | 11,541 | ||||||||
| (5) | Income from operations % is determined by dividing income from operations per our accompanying financial statements presented in accordance with GAAP by total revenues. |
| (6) | As adjusted information gives effect to the application of the net proceeds from the sale of 750,000 shares of our common stock offered by us in this offering at an assumed offering price of $28.75 per share, less the underwriting discount and estimated offering expenses payable by us, to repay approximately $19.7 million of indebtedness under our revolving credit facility. |
6
An investment in our common stock involves a high degree of risk. You should carefully read and consider the risks described below before deciding to invest in our common stock. If any of the following risks actually occurs, our business, financial condition, results of operation or cash flows could be materially harmed. In any such case, the trading price of our common stock could decline, and you could lose all or part of your investment. When determining whether to buy our common stock, you should also refer to the other information in this prospectus, including our consolidated financial statements and the related notes.
Risks related to our business
Our growth strategy depends on opening new restaurants. Our ability to expand our restaurant base is influenced by factors beyond our control, which may slow restaurant development and expansion and impair our growth strategy.
We are pursuing an aggressive but disciplined growth strategy which, to be successful, will depend in large part on our ability and the ability of our franchisees to open new restaurants and to operate these restaurants on a profitable basis. We anticipate that our new restaurants will generally take several months to reach planned operating levels due to inefficiencies typically associated with new restaurants, including lack of market awareness, the need to hire and train sufficient team members and other factors. We cannot guarantee that we or our franchisees will be able to achieve our expansion goals or that new restaurants will be operated profitably. Further, we cannot assure you that any restaurant we open will obtain operating results similar to those of our existing restaurants. One of our biggest challenges in meeting our growth objectives will be to locate and secure an adequate supply of suitable new restaurant sites. We have experienced delays in opening some of our restaurants and may experience delays in the future. Delays or failures in opening new restaurants could materially and adversely affect our planned growth. The success of our planned expansion will depend upon numerous factors, many of which are beyond our control, including the following:
| • | the hiring, training and retention of qualified operating personnel, especially managers; |
| • | reliance on the knowledge of our executives and franchisees to identify available and suitable restaurant sites; |
| • | competition for restaurant sites; |
| • | negotiation of favorable lease terms; |
| • | timely development of new restaurants, including the availability of construction materials and labor; |
| • | management of construction and development costs of new restaurants; |
| • | securing required governmental approvals and permits in a timely manner, or at all; |
| • | cost and availability of capital; |
| • | competition in our markets; and |
| • | general economic conditions. |
Our restaurant expansion strategy focuses primarily on further penetrating existing markets. This strategy could cause sales in some of our existing restaurants to decline.
Our areas of highest concentration are California, Colorado, Washington and Oregon. In accordance with our expansion strategy, we intend to open new restaurants primarily in our existing markets. Because we typically draw guests from a relatively small radius around each of our restaurants, the sales performance and guest counts for restaurants near the area in which a new restaurant opens may decline due to the opening of new restaurants.
7
Our expansion into new markets may present increased risks due to our unfamiliarity with the area.
Some of our new restaurants will be located in areas where we have little or no meaningful experience. Those markets may have different competitive conditions, consumer tastes and discretionary spending patterns than our existing markets, which may cause our new restaurants to be less successful than restaurants in our existing markets. An additional risk in expansion into new markets is the lack of market awareness of the Red Robin® brand. Restaurants opened in new markets may open at lower average weekly sales volumes than restaurants opened in existing markets, and may have higher restaurant-level operating expense ratios than in existing markets. Sales at restaurants opened in new markets may take longer to reach average annual company-owned restaurant sales, if at all, thereby affecting the profitability of these restaurants.
Our expansion may strain our infrastructure and other resources, which could slow our restaurant development or cause other problems.
We face the risk that our existing systems and procedures, restaurant management systems, financial controls, information systems, management resources and human resources will be inadequate to support our planned expansion of company-owned and franchised restaurants. We may not be able to respond on a timely basis to all of the changing demands that our planned expansion will impose on our infrastructure and other resources. If we fail to continue to improve our infrastructure or to manage other factors necessary for us to achieve our expansion objectives, our operating results could be materially negatively affected.
Our ability to utilize our revolving credit facility and our ability to raise capital in the future may be limited, which could adversely impact our business.
Our revolving credit facility contains a number of restrictive covenants that limit our ability to, among other things, engage in mergers, acquisitions, joint ventures and sale-leaseback transactions, and to sell assets, incur indebtedness, make investments, create liens and pay dividends. Our revolving credit facility also requires us to maintain compliance with specified financial ratios and tests. These restrictions could affect our ability to operate our business and may limit our ability to take advantage of potential business opportunities as they arise. In addition, since our revolving credit facility expires in May 2006, we cannot give any assurance that we will be able to renew this facility at or prior to that time.
Changes in our operating plans, acceleration of our expansion plans, lower than anticipated sales, increased expenses or other events, including those described in this section, may cause us to seek additional debt or equity financing on an accelerated basis. Financing may not be available on acceptable terms, or at all, and our failure to raise capital when needed could negatively impact our growth and other plans as well as our financial condition and results of operations. Additional equity financing may be dilutive to the holders of our common stock and debt financing, if available, may involve significant cash payment obligations and covenants and/or financial ratios that restrict our ability to operate our business.
If our franchisees cannot develop or finance new restaurants or build them on suitable sites or open them on schedule, our growth and success may be impeded.
Under our current form of area development agreement, franchisees must develop a predetermined number of restaurants in their area according to a schedule that lasts for the term of their development agreement. Franchisees may not have access to the financial or management resources that they need to open the restaurants required by their development schedules, or be able to find suitable sites on which to develop them. Franchisees may not be able to negotiate acceptable lease or purchase terms for the sites, obtain the necessary permits and government approvals or meet construction schedules. In the past, we have agreed to extend or modify development schedules for certain area developers, and we may do so in the future. Any of these problems could slow our growth and reduce our franchise revenues.
8
Additionally, our franchisees depend upon financing from banks and other financial institutions in order to construct and open new restaurants. Over the past several years, financing has been difficult for small operators to obtain. Should these conditions continue into the future, the lack of adequate availability of debt financing could adversely affect the number and rate of new restaurant openings by our franchisees and adversely affect our future franchise revenues.
Our franchisees could take actions that could harm our business.
Franchisees are independent contractors and are not our employees. We provide training and support to franchisees, but the quality of franchised restaurant operations may be diminished by any number of factors beyond our control. Consequently, franchisees may not successfully operate restaurants in a manner consistent with our standards and requirements, or may not hire and train qualified managers and other restaurant personnel. Our image and reputation, and the image and reputation of other franchisees, may suffer materially and system-wide sales could significantly decline if our franchisees do not operate successfully.
The acquisition of existing restaurants from our franchisees may have unanticipated consequences that could harm our business and financial condition.
We may seek to selectively acquire existing restaurants from our franchisees. To do so, we would need to identify suitable acquisition candidates, negotiate acceptable acquisition terms and obtain appropriate financing. Any acquisition that we pursue, whether or not successfully completed, may involve risks, including:
| • | material adverse effects on our operating results, particularly in the quarters immediately following the acquisition as it is integrated into our operations; |
| • | risks associated with entering into markets or conducting operations where we have no or limited prior experience; and |
| • | the diversion of management’s attention from other business concerns. |
Future acquisitions of existing restaurants from our franchisees, which may be accomplished through a cash purchase transaction or the issuance of our equity securities, or a combination of both, could result in potentially dilutive issuances of our equity securities, the incurrence of debt and contingent liabilities and impairment charges related to goodwill and other intangible assets, any of which could harm our business and financial condition.
Our operations are susceptible to changes in food availability and costs that could adversely affect our operating results.
Our profitability depends in part on our ability to anticipate and react to changes in food costs. We rely on SYSCO Corporation, a national food distributor, as the primary distributor of our food ingredients, supplies and other products. Any increase in distribution prices or failure to perform by SYSCO could cause our food costs to increase. There also could be a significant short-term disruption in our supply chain if SYSCO failed to meet our distribution requirements or our relationship was terminated at the end of the contract term on June 30, 2004 or earlier by SYSCO upon breach or material deterioration of our financial position. Further, various factors beyond our control, including adverse weather conditions, governmental regulation, production, availability, recalls of food products and seasonality may affect our food costs or cause a disruption in our supply chain. Chicken represented approximately 19.2% and beef represented approximately 8.2% of our food purchases in 2002. We enter into annual contracts with our beef and chicken suppliers. Our contracts for chicken are fixed price contracts. Our contracts for beef are generally based on current market prices plus a processing fee. Changes in the price or availability of chicken or beef could materially adversely affect our profitability. We cannot predict whether we will be able to anticipate and react to changing food costs by adjusting our purchasing practices and menu prices, and a failure to do so could adversely affect our operating results. In addition, because we provide a “value-priced” product, we may not seek to or be able to pass along price increases to our guests.
9
Our quarterly operating results may fluctuate significantly and could fall below the expectations of securities analysts and investors due to seasonality and other factors, resulting in a decline in our stock price.
Our quarterly operating results may fluctuate significantly because of several factors, including:
| • | the timing of new restaurant openings and related expenses; |
| • | restaurant operating costs for our newly-opened restaurants, which are often materially greater during the first several months of operation than thereafter, and pre-opening costs; |
| • | labor availability and costs for hourly and management personnel; |
| • | profitability of our restaurants, especially in new markets; |
| • | franchise development costs; |
| • | increases and decreases in comparable restaurant sales; |
| • | impairment of long-lived assets, including goodwill, and any loss on restaurant closures; |
| • | changes in borrowings and interest rates; |
| • | general economic conditions; |
| • | changes in consumer preferences and competitive conditions |
| • | fluctuations in food and commodity prices; and |
| • | fluctuations in costs attributable to public company compliance costs, including Sarbanes-Oxley Act related costs. |
Our business is also subject to seasonal fluctuations. Historically, sales in most of our restaurants have been higher during the summer months and winter holiday season of each year. As a result, our quarterly and annual operating results and comparable restaurant sales may fluctuate significantly as a result of seasonality and the factors discussed above. Accordingly, results for any one quarter are not necessarily indicative of results to be expected for any other quarter or for any year and comparable restaurant sales for any particular future period may decrease. In the future, operating results may fall below the expectations of securities analysts and investors. In that event, the price of our common stock would likely decrease.
A decline in visitors to any of the retail centers, big box shopping centers or entertainment centers near the locations of our restaurants could negatively affect our restaurant sales.
Our restaurants are primarily located near high activity areas such as retail centers, big box shopping centers and entertainment centers. We depend on high visitor rates at these centers to attract guests to our restaurants. If visitors to these centers decline due to economic conditions, changes in consumer preferences or shopping patterns, changes in discretionary consumer spending or otherwise, our restaurant sales could decline significantly and adversely affect our results of operations.
If we lose the services of any of our key management personnel, our business could suffer.
Our future success significantly depends on the continued services and performance of our key management personnel, particularly Mike Snyder, our chief executive officer and president; Jim McCloskey, our chief financial officer; Mike Woods, our senior vice president of franchise development; Bob Merullo, our senior vice president of restaurant operations; Todd Brighton, our vice president of development; and Eric Houseman, our vice president of restaurant operations. Our future performance will depend on our ability to motivate and retain these and other executive officers and key team members, particularly regional operations directors, restaurant general managers and kitchen managers. Competition for these employees is intense. The loss of the services of members of our senior management or key team members or the inability to attract additional qualified personnel as needed could materially harm our business.
10
Approximately 77.0% of our company-owned restaurants are located in the Western United States and, as a result, we are sensitive to economic and other trends and developments in this region.
We currently operate a total of 87 company-owned restaurants in the Western United States. As a result, we are particularly susceptible to adverse trends and economic conditions in this region, including its labor market. In addition, given our geographic concentration, negative publicity regarding any of our restaurants in the Western United States could have a material adverse effect on our business and operations, as could other regional occurrences such as local strikes, energy shortages or increases in energy prices, droughts, earthquakes, fires or other natural disasters.
Our future success depends on our ability to protect our proprietary information.
Our business prospects will depend in part on our ability to develop favorable consumer recognition of the Red Robin® name and logo. Although Red Robin®, America’s Gourmet Burgers & Spirits® and Mad Mixology® are federally registered trademarks with the United States Patent and Trademark Office and in Canada, our trademarks could be infringed in ways that leave us without redress, such as by imitation. In addition, we rely on trade secrets and proprietary know-how, and we employ various methods, to protect our concepts and recipes. However, such methods may not afford adequate protection and others could independently develop similar know-how or obtain access to our know-how, concepts and recipes. Moreover, we may face claims of infringement that could interfere with our use of our proprietary know-how, concepts, recipes or trade secrets. Defending against such claims may be costly and, if we are unsuccessful, we may be prevented from continuing to use such proprietary information in the future and/or be forced to pay damages. We do not maintain confidentiality and non-competition agreements with all of our executives, key personnel or suppliers. In the event competitors independently develop or otherwise obtain access to our know-how, concepts, recipes or trade secrets, the appeal of our restaurants could be reduced and our business could be harmed. We franchise our system to various franchisees. While we try to ensure that the quality of our brand and compliance with our operating standards, and the confidentiality thereof are maintained by all of our franchisees, we cannot assure that our franchisees will avoid actions that adversely affect the reputation of Red Robin or the value of our proprietary information.
Compliance with changing regulation of corporate governance and public disclosure may result in additional expenses.
Keeping abreast of, and in compliance with, changing laws, regulations and standards relating to corporate governance and public disclosure, including the Sarbanes-Oxley Act of 2002, new SEC regulations and Nasdaq Stock Market rules, has required an increased amount of management attention and external resources. We remain committed to maintaining high standards of corporate governance and public disclosure. As a result, we intend to invest all reasonably necessary resources to comply with evolving standards, and this investment may result in increased general and administrative expenses and a diversion of management time and attention from revenue-generating activities to compliance activities.
Risks related to the restaurant industry
Changes in consumer preferences or discretionary consumer spending could negatively impact our results of operations.
Our restaurants feature burgers, salads, soups, appetizers, other entrees such as rice bowls and pasta, desserts and our signature Mad Mixology® alcoholic and non-alcoholic beverages in a family-friendly atmosphere. Our continued success depends, in part, upon the popularity of these foods and this style of casual dining. Shifts in consumer preferences away from this cuisine or dining style could materially adversely affect our future profitability. The restaurant industry is characterized by the continual introduction of new concepts and is subject to rapidly changing consumer preferences, tastes and eating and purchasing habits. While burger consumption in the United States has grown in the past, the demand may not continue to grow or taste trends may
11
change. Our success will depend in part on our ability to anticipate and respond to changing consumer preferences, tastes and eating and purchasing habits, as well as other factors affecting the food service industry, including new market entrants and demographic changes. Also, our success depends to a significant extent on numerous factors affecting discretionary consumer spending, including economic conditions, disposable consumer income and consumer confidence. Adverse changes in these factors could reduce guest traffic or impose practical limits on pricing, either of which could harm our results of operations.
Health concerns relating to the consumption of beef or other food products could affect consumer preferences and could negatively impact our results of operations.
Like other restaurant chains, consumer preferences could be affected by health concerns about the consumption of beef, the key ingredient in many of our menu items, or negative publicity concerning food quality, illness and injury generally, such as negative publicity concerning E. coli, “mad cow” or “foot-and-mouth” disease, publication of government or industry findings concerning food products served by us or our franchisees, or other health concerns or operating issues stemming from one restaurant or a limited number of restaurants. This negative publicity may adversely affect demand for our food and could result in a material decrease in guest traffic to our restaurants. If we react to the negative publicity by changing our concept or our menu, we may lose guests who do not prefer the new concept or menu, and may not be able to attract a sufficient new guest base to produce the revenue needed to make our restaurants profitable. In addition, we may have different or additional competitors for our intended guests as a result of a concept change and may not be able to compete successfully against those competitors. A decrease in guest traffic to our restaurants as a result of these health concerns or negative publicity or as a result of a change in our menu or concept could materially harm our business.
Labor shortages could slow our growth or harm our business.
Our success depends in part upon our ability to attract, motivate and retain a sufficient number of qualified, high-energy team members. Qualified individuals of the requisite caliber and number needed to fill these positions are in short supply in some areas. The inability to recruit and retain these individuals may delay the planned openings of new restaurants or result in high employee turnover in existing restaurants, which could harm our business. Additionally, competition for qualified team members could require us to pay higher wages to attract sufficient team members, which could result in higher labor costs. Most of our employees are paid on an hourly basis. These employees are paid in accordance with applicable minimum wage regulations. Accordingly, any increase, whether city, state, federal or otherwise, could have a material adverse impact on our business.
We are subject to extensive government laws and regulations that govern various aspects of our business. Our operations and our ability to expand and develop our restaurants may be adversely affected by these laws and regulations, which could cause our revenues to decline and adversely affect our growth strategy.
The restaurant industry is subject to various federal, state and local government regulations, including those relating to the sale of food and alcoholic beverages. While at this time we have been able to obtain and maintain the necessary governmental licenses, permits and approvals, the failure to maintain these licenses, permits and approvals, including food and liquor licenses, could adversely affect our operating results. Difficulties or failure in obtaining the required licenses and approvals could delay or result in our decision to cancel the opening of new restaurants. Local authorities may suspend or deny renewal of our food and liquor licenses if they determine that our conduct does not meet applicable standards or if there are changes in regulations.
We are subject to “dram shop” statutes in some states. These statutes generally allow a person injured by an intoxicated person to recover damages from an establishment that wrongfully served alcoholic beverages to the intoxicated person. A judgment substantially in excess of our insurance coverage could harm our financial condition.
Various federal and state labor laws govern our relationship with our employees and affect operating costs. These laws include minimum wage requirements, overtime pay, unemployment tax rates, workers’ compensation
12
rates, citizenship requirements and sales taxes. Additional government-imposed increases in minimum wages, overtime pay, paid leaves of absence and mandated health benefits such as those to be imposed by recently enacted legislation in California, increased tax reporting and tax payment requirements for employees who receive gratuities, or a reduction in the number of states that allow tips to be credited toward minimum wage requirements could harm our operating results.
The Federal Americans with Disabilities Act prohibits discrimination on the basis of disability in public accommodations and employment. Although our restaurants are designed to be accessible to the disabled, we could be required to make modifications to our restaurants to provide service to, or make reasonable accommodations for, disabled persons.
We are also subject to federal regulation and state laws that regulate the offer and sale of franchises and aspects of the licensor-licensee relationship. Many state franchise laws impose restrictions on the franchise agreement, including limitations on non-competition provisions and the termination or non-renewal of a franchise. Some states require that franchise materials be registered before franchises can be offered or sold in the state.
A significant increase in litigation could have a material adverse effect on our results of operations, financial condition and business prospects.
As a participant in the restaurant industry, we are sometimes the subject of complaints or litigation from guests alleging illness, injury or other food quality, health or operational concerns. Recently, the restaurant industry also has been subject to an increase in claims that the menus and practices of restaurant chains have led to the obesity of some guests. Adverse publicity resulting from these allegations could harm our restaurants, regardless of whether the allegations are valid or whether we are liable. In fact, we are subject to the same risks of adverse publicity resulting from these sorts of allegations even if the claim actually involves one of our franchisees. Further, employee claims against us based on, among other things, discrimination, harassment or wrongful termination may divert our financial and management resources that would otherwise be used to benefit the future performance of our operations.
Our success depends on our ability to compete effectively in the restaurant industry.
Competition in the restaurant industry is increasingly intense. We compete on the basis of the taste, quality, and price of food offered, guest service, ambiance and overall dining experience. We believe that our operating concept, attractive dining value and quality of food and guest service, enable us to differentiate ourselves from our competitors. Our competitors include a large and diverse group of restaurant chains and individual restaurants that range from independent local operators that have opened restaurants in various markets, to well-capitalized national restaurant companies. In addition, we compete with other restaurants and with retail establishments for real estate. Many of our competitors are well established in the casual dining market segment and some of our competitors have substantially greater financial, marketing and other resources than do we.
Risks related to this offering
Our stock price may be volatile.
The market for equity securities has been extremely volatile. The following factors could cause the price of our common stock in the public market to fluctuate significantly from the price you will pay in this offering:
| • | actual or anticipated variations in our quarterly results of operations; |
| • | changes in market valuations of companies in our industry; |
| • | changes in expectations of future financial performance or changes in estimates of securities analysts; |
| • | fluctuations in stock market prices and volumes; |
13
| • | issuances of common stock or other securities in the future; and |
| • | the addition or departure of key personnel. |
Our common stock began trading on July 19, 2002 and prior to this date there was no public market for shares of our common stock. The stock market has experienced significant price and volume fluctuations. Fluctuations or decreases in the trading price of our common stock may adversely affect stockholders’ ability to trade their shares. In the past, following periods of volatility in the market price of a company’s securities, securities class action litigation has often been instituted. A securities class action suit against us could result in substantial costs and divert management’s attention and resources that would otherwise be used to benefit the future performance of our operations.
Approximately 36.4% of our outstanding shares of common stock may be sold into the public market in the future, which could depress our stock price.
Including the 3,458,673 shares of common stock sold in this offering (and any shares sold upon exercise of the underwriters’ over-allotment option), there will be 10,143,594 shares freely tradable without restriction under the Securities Act of 1933, except for any shares held by our officers, directors and principal stockholders.
After this offering, approximately 5,097,377 shares of our common stock that are outstanding and held by our affiliates will be subject to the volume and other limitations of Rule 144 or Rule 701 under the Securities Act. Red Robin, as well as our directors, officers and significant stockholders (who together will beneficially own 5,245,772 shares after the offering), have agreed not to sell or otherwise dispose of any of their shares for a period of 90 days after the date of this prospectus without the prior written consent of Banc of America Securities LLC. In its sole discretion and at any time without notice to the public market, Banc of America Securities LLC may release all or any portion of the shares subject to the lock-up agreements. All of the shares subject to lock-up agreements will become available for sale in the public market immediately following expiration of the 90-day lock-up period, subject (to the extent applicable) to the volume and other limitations of Rule 144 or Rule 701 under the Securities Act. After expiration of the lock-up period, some of our stockholders have the contractual right to require us to register up to 5,464,144 of their shares of common stock for future sale.
In addition, up to 780,269 shares of our common stock issuable pursuant to stock options are eligible for sale in the public market, together with any additional shares of common stock that will be issuable pursuant to stock options or other stock rights granted in the future under our stock option plans and any shares purchased by our employees under our employees stock purchase plan.
Sales of substantial amounts of common stock in the public market, or the perception that these sales may occur, could adversely affect the prevailing market price of our common stock and our ability to raise capital through a public offering of our equity securities. See “Shares Eligible for Future Sale” which describes the circumstances under which restricted shares or shares held by affiliates may be sold in the public market.
Some of our stockholders could exert significant influence or control over us, and may not make decisions that are in the best interests of all stockholders.
After this offering, Quad-C, through its affiliates, will own approximately 19.3% of our outstanding common stock and Mike Snyder will own approximately 9.3% of our outstanding common stock. Our officers, directors and principal stockholders, i.e., stockholders holding more than 5.0% of our common stock, including Quad-C and Mike Snyder, together will hold approximately 32.2% of our outstanding common stock. These stockholders, acting individually or together, could exert significant influence over all matters requiring stockholder approval, including the election of directors and approval of significant corporate transactions. This concentration of ownership may delay or prevent a change in control of our company, and make some transactions more difficult or impossible without the support of these stockholders. Also, the interests of these
14
stockholders may not always coincide with our interests as a company or the interest of other stockholders. Accordingly, Quad-C, Mike Snyder and these other stockholders could cause us to enter into transactions or agreements that our other shareholders might not approve. Our certificate of incorporation and bylaws require a 66 2/3% supermajority vote of our stockholders only to remove a director or to amend specified provisions of our certificate of incorporation or bylaws.
Provisions in Delaware law and our charter may prevent or delay a change of control, even if that change of control may be beneficial to our stockholders.
We are subject to the Delaware anti-takeover laws regulating corporate takeovers. These anti-takeover laws prevent Delaware corporations from engaging in business combinations with any stockholder, including all affiliates and associates of the stockholder, who owns 15.0% or more of the corporation’s outstanding voting stock, for three years following the date that the stockholder acquired 15.0% or more of the corporation’s voting stock unless specified conditions are met.
Our amended and restated certificate of incorporation and our amended and restated bylaws include a number of provisions that may deter or impede hostile takeovers or changes of control of management. These provisions:
| • | authorize our board of directors to establish one or more series of preferred stock, the terms of which can be determined by the board of directors at the time of issuance; |
| • | divide our board of directors into three classes of directors, with each class serving a staggered three-year term. As the classification of the board of directors generally increases the difficulty of replacing a majority of the directors, it may tend to discourage a third party from making a tender offer or otherwise attempting to obtain control of us and may maintain the composition of the board of directors; |
| • | do not provide for cumulative voting in the election of directors unless required by applicable law. Under cumulative voting, a minority stockholder holding a sufficient percentage of a class of shares may be able to ensure the election of one or more directors; |
| • | provide that a director may be removed from our board of directors only for cause, and then only by a supermajority vote of the outstanding shares; |
| • | require that any action required or permitted to be taken by our stockholders must be effected at a duly called annual or special meeting of stockholders and may not be effected by any consent in writing; |
| • | state that special meetings of our stockholders may be called only by the chairman of the board of directors, our chief executive officer, by the board of directors after a resolution is adopted by a majority of the total number of authorized directors, or by the holders of not less than 10.0% of our outstanding voting stock; |
| • | provide that the chairman or other person presiding over any stockholder meeting may adjourn the meeting whether or not a quorum is present at the meeting; |
| • | establish advance notice requirements for submitting nominations for election to the board of directors and for proposing matters that can be acted upon by stockholders at a meeting; |
| • | provide that certain provisions of our certificate of incorporation can be amended only by supermajority vote of the outstanding shares, and that our bylaws can be amended only by supermajority vote of the outstanding shares or our board of directors; |
| • | allow our directors, not our stockholders, to fill vacancies on our board of directors; and |
| • | provide that the authorized number of directors may be changed only by resolution of the board of directors. |
15
Certain information contained in this prospectus includes forward-looking statements. Forward-looking statements include statements regarding our expectations, beliefs, intentions, plans, objectives, goals, strategies, future events or performance and underlying assumptions and other statements which are other than statements of historical facts. These statements may be identified, without limitation, by the use of forward looking terminology such as “may,” “will,” “anticipates,” “expects,” “believes,” “intends,” “should” or comparable terms or the negative thereof. All forward-looking statements included in this prospectus are based on information available to us on the date hereof. These statements involve risks and uncertainties that could cause actual results to differ materially from those described in the statements. These risks and uncertainties include, but are not limited to, the following:
| • | our ability to achieve and manage our planned expansion; |
| • | our ability to raise capital in the future; |
| • | the ability of our franchisees to open and manage new restaurants; |
| • | our franchisees’ adherence to our practices, policies and procedures; |
| • | changes in the availability and cost of food; |
| • | potential fluctuation in our quarterly operating results due to seasonality and other factors; |
| • | the continued service of key management personnel; |
| • | the concentration of our restaurants in the Western United States; |
| • | our ability to protect our name and logo and other proprietary information; |
| • | changes in consumer preferences, general economic conditions or consumer discretionary spending; |
| • | health concerns about our food products; |
| • | our ability to attract, motivate and retain qualified team members; |
| • | the impact of federal, state or local government regulations relating to our team members or the sale of food or alcoholic beverages; |
| • | the impact of litigation; |
| • | the effect of competition in the restaurant industry; |
| • | cost and availability of capital; |
| • | additional costs associated with compliance, including the Sarbanes-Oxley Act and related regulations and requirements; and |
| • | other risk factors described from time to time in SEC reports filed by Red Robin. |
Other risks, uncertainties and factors, including those discussed under “Risk Factors,” could cause our actual results to differ materially from those projected in any forward-looking statements we make. The list of factors that may affect future performance and the accuracy of forward-looking statements is illustrative, but by no means exhaustive. Accordingly, all forward-looking statements should be evaluated with the understanding of their inherent uncertainty.
We assume no obligation to publicly update or revise these forward-looking statements for any reason, or to update the reasons actual results could differ materially from those anticipated in these forward-looking statements, even if new information becomes available in the future.
16
We estimate that we will receive net proceeds from the sale of 750,000 shares of common stock in this offering of approximately $19.7 million, based on an assumed offering price of $28.75 per share, after deducting underwriting discounts and commissions and estimated offering expenses. We will not receive any proceeds from the sale of shares by the selling stockholders.
We intend to use the proceeds of this offering to repay approximately $19.7 million of indebtedness under our revolving credit facility, which bore interest at 3.4% as of October 5, 2003, and has a maturity date of May 19, 2006, and the remaining proceeds, if any, will be used for general corporate purposes, including opening new restaurants and the acquisition of existing restaurants from franchisees. We regularly consider acquisitions of existing restaurants from our franchisees in the ordinary course of business, although we currently have no agreements regarding any future acquisitions. Any proceeds used to repay borrowings under our revolving credit facility will result in an increase in the amount of future borrowings available to us, subject to the terms of our revolving credit agreement.
Our common stock is listed on the The Nasdaq Stock Market’s National Market under the symbol RRGB. The table below sets forth the high and low per share sales prices for our common stock as reported by The Nasdaq Stock Market’s National Market. Our initial public offering became effective in July 2002. There was no established public trading market for our common stock prior to that date.
| Sales Price | ||||||
| High |
Low | |||||
| 2003 |
||||||
| 3rd quarter |
$ | 27.05 | $ | 20.95 | ||
| 2nd quarter |
22.66 | 14.50 | ||||
| 1st quarter |
15.69 | 11.50 | ||||
| 2002 |
||||||
| 4th quarter |
$ | 14.28 | $ | 9.27 | ||
| 3rd quarter(1) |
13.20 | 9.76 | ||||
| (1) | Trading of our common stock began on July 19, 2002 |
The closing price of our common stock on November 5, 2003 was $28.75. As of November 5, 2003, there were approximately 2,300 holders of our common stock.
We did not declare or pay any cash dividends on our common stock in 2001, 2002 or 2003. We currently anticipate that we will retain any future earnings for the operation and expansion of our business. In addition, our revolving credit agreement prohibits us from declaring or paying any dividends or making any other distributions on any shares of our capital stock, subject to specified exceptions. Accordingly, we do not anticipate declaring or paying any cash dividends on our common stock in the foreseeable future.
Any future determination related to our dividend policy will be made at the discretion of our board of directors and will depend on then existing conditions, including our financial condition, results of operations, contractual restrictions, capital requirements, business prospects and other factors our board of directors may deem relevant.
17
The following table sets forth our cash, cash equivalents and capitalization as of October 5, 2003:
| • | on an actual basis; and |
| • | on an as adjusted basis to give effect to the application of the net proceeds from the sale of 750,000 shares of our common stock offered by us in this offering at an assumed offering price of $28.75 per share, less the underwriting discount and estimated offering expenses payable by us to repay approximately $19.7 million of indebtedness under our revolving credit facility. |
You should read the following table in conjunction with “Management’s Discussion and Analysis of Financial Condition and Results of Operations” and our consolidated financial statements and the related notes included elsewhere in this prospectus.
| October 5, 2003 |
||||||||
| Actual |
As Adjusted |
|||||||
| (unaudited) | ||||||||
| (in thousands) | ||||||||
| Cash and cash equivalents |
$ | 3,222 | $ | 3,222 | ||||
| Current portion of long-term debt and capital lease obligations |
$ | 1,359 | $ | 1,359 | ||||
| Long-term debt and capital lease obligations, excluding revolving credit facility |
16,498 | 16,498 | ||||||
| Revolving credit facility |
33,686 | 14,006 | ||||||
| Long-term debt |
50,184 | 30,504 | ||||||
| Stockholders’ equity: |
||||||||
| Common stock, $0.001 par value; 30,000,000 shares authorized, 15,206,074 shares issued and outstanding, actual; 30,000,000 shares authorized, 15,956,074 shares issued and outstanding, as adjusted(1) |
15 | 16 | ||||||
| Additional paid-in capital |
104,048 | 123,727 | ||||||
| Deferred compensation |
(150 | ) | (150 | ) | ||||
| Receivables from stockholders/officers |
(6,364 | ) | (6,364 | ) | ||||
| Accumulated other comprehensive loss, net of tax benefit |
(123 | ) | (123 | ) | ||||
| Retained earnings |
13,918 | 13,918 | ||||||
| Total stockholders’ equity |
111,344 | 131,024 | ||||||
| Total capitalization |
$ | 162,887 | $ | 162,887 | ||||
| (1) | Excludes 780,269 shares of common stock issuable on the exercise of stock options outstanding as of October 5, 2003 and 290,738 shares of common stock reserved for future issuance under our employee stock purchase plan. |
18
SELECTED CONSOLIDATED FINANCIAL AND OPERATING DATA
The following table contains selected consolidated financial and operating data. The statement of income, cash flow and balance sheet data for each year is derived from our consolidated financial statements, which have been audited by independent auditors. The statement of income, cash flow and balance sheet data for each forty week period is derived from our unaudited consolidated financial statements which, in the opinion of management, reflect all adjustments necessary to present fairly, in accordance with accounting principles generally accepted in the United States, the information for the periods. The operating results for any interim period are not necessarily indicative of results for a full year. You should read this information together with “Management’s Discussion and Analysis of Financial Condition and Results of Operations” and our consolidated financial statements and the related notes included elsewhere in this prospectus.
| Fiscal Year Ended |
Forty Weeks Ended |
|||||||||||||||||||||||||||
| 1998 |
1999 |
2000(1) |
2001 |
2002 |
October 6, 2002 |
October 5, 2003 |
||||||||||||||||||||||
| (in thousands, except per share data, restaurant-related data and footnotes) |
||||||||||||||||||||||||||||
| (unaudited) | ||||||||||||||||||||||||||||
| Statement of Income Data(2): |
||||||||||||||||||||||||||||
| Revenue: |
||||||||||||||||||||||||||||
| Restaurant |
$ | 110,953 | $ | 121,430 | $ | 180,414 | $ | 214,963 | $ | 265,518 | $ | 201,878 | $ | 240,468 | ||||||||||||||
| Franchise royalties and fees |
7,193 | 8,249 | 8,247 | 9,002 | 8,565 | 6,683 | 6,967 | |||||||||||||||||||||
| Rent revenue |
69 | 333 | 509 | 520 | 327 | 282 | 369 | |||||||||||||||||||||
| Total revenues |
118,215 | 130,012 | 189,170 | 224,485 | 274,410 | 208,843 | 247,804 | |||||||||||||||||||||
| Costs and expenses: |
||||||||||||||||||||||||||||
| Restaurant operating costs: |
||||||||||||||||||||||||||||
| Cost of sales |
27,679 | 30,159 | 43,945 | 50,914 | 61,084 | 46,689 | 56,452 | |||||||||||||||||||||
| Labor |
39,089 | 43,504 | 64,566 | 74,854 | 94,030 | 72,059 | 85,117 | |||||||||||||||||||||
| Operating |
17,382 | 19,429 | 27,960 | 33,195 | 40,428 | 30,587 | 36,362 | |||||||||||||||||||||
| Occupancy |
6,379 | 7,998 | 11,519 | 14,785 | 18,095 | 13,955 | 16,376 | |||||||||||||||||||||
| Restaurant closures and impairment |
140 | (330 | ) | 1,302 | 36 | 1,133 | — | — | ||||||||||||||||||||
| Depreciation and amortization |
5,008 | 5,394 | 8,237 | 10,491 | 12,883 | 9,417 | 12,110 | |||||||||||||||||||||
| General and administrative |
13,578 | 13,434 | 17,116 | 16,845 | 20,260 | 15,081 | 17,150 | |||||||||||||||||||||
| Franchise development |
1,982 | 2,508 | 3,386 | 3,704 | 3,256 | 2,655 | 2,180 | |||||||||||||||||||||
| Pre-opening costs |
— | 771 | 2,506 | 921 | 1,879 | 1,610 | 2,414 | |||||||||||||||||||||
| Gain on lease buy-out |
— | — | — | — | (945 | ) | (945 | ) | — | |||||||||||||||||||
| Impairment of property held for sale |
— | — | — | — | 150 | 150 | — | |||||||||||||||||||||
| Total costs and expenses |
111,237 | 122,867 | 180,537 | 205,745 | 252,253 | 191,258 | 228,161 | |||||||||||||||||||||
| Income from operations |
6,978 | 7,145 | 8,633 | 18,740 | 22,157 | 17,585 | 19,643 | |||||||||||||||||||||
| Other (income) expense: |
||||||||||||||||||||||||||||
| Interest expense |
4,460 | 4,156 | 6,482 | 7,850 | 5,769 | 4,857 | 2,331 | |||||||||||||||||||||
| Interest income |
(282 | ) | (186 | ) | (742 | ) | (746 | ) | (398 | ) | (205 | ) | (256 | ) | ||||||||||||||
| Loss on extinguishment of debt |
— | — | — | — | 4,336 | 4,272 | 257 | |||||||||||||||||||||
| Other expense |
595 | 391 | 19 | 190 | 105 | 62 | 19 | |||||||||||||||||||||
| Total other expense |
4,773 | 4,361 | 5,759 | 7,294 | 9,812 | 8,986 | 2,351 | |||||||||||||||||||||
| Income before income taxes |
2,205 | 2,784 | 2,874 | 11,446 | 12,345 | 8,599 | 17,292 | |||||||||||||||||||||
| (Provision) benefit for income taxes(3) |
33 | 1,596 | 12,557 | (3,722 | ) | (4,081 | ) | (3,002 | ) | (5,751 | ) | |||||||||||||||||
| Net income(3) |
$ | 2,238 | $ | 4,380 | $ | 15,431 | $ | 7,724 | $ | 8,264 | $ | 5,597 | $ | 11,541 | ||||||||||||||
| Net income per common share(3) |
||||||||||||||||||||||||||||
| Basic |
$ | 0.78 | $ | 1.47 | $ | 2.07 | $ | 0.77 | $ | 0.67 | $ | 0.49 | $ | 0.76 | ||||||||||||||
| Diluted |
$ | 0.78 | $ | 1.47 | $ | 2.07 | $ | 0.75 | $ | 0.65 | $ | 0.47 | $ | 0.75 | ||||||||||||||
| Shares used in computing net income per common share |
||||||||||||||||||||||||||||
| Basic |
2,903 | 2,971 | 7,444 | 10,085 | 12,278 | 11,461 | 15,092 | |||||||||||||||||||||
| Diluted |
2,903 | 2,971 | 7,444 | 10,236 | 12,660 | 11,888 | 15,343 | |||||||||||||||||||||
| Cash flow Data: |
||||||||||||||||||||||||||||
| Net cash provided by operating activities |
$ | 8,214 | $ | 7,339 | $ | 8,184 | $ | 25,762 | $ | 29,114 | $ | 18,151 | $ | 31,597 | ||||||||||||||
| Selected Operating Data: |
||||||||||||||||||||||||||||
| System-wide restaurants open at end of period |
131 | 144 | 164 | 182 | 194 | 194 | 211 | |||||||||||||||||||||
| Company-owned restaurants open at end of period |
44 | 46 | 73 | 77 | 96 | 95 | 110 | |||||||||||||||||||||
| Average annual comparable company-owned restaurant sales(4) |
$ | 2,496 | $ | 2,664 | $ | 2,896 | $ | 3,066 | $ | 2,982 | ||||||||||||||||||
| Comparable company-owned restaurant sales increase (4) |
4.9 | % | 5.8 | % | 7.1 | % | 1.8 | % | 1.8 | % | 1.6 | % | 3.7 | % | ||||||||||||||
| Restaurant-level operating profit %(5) |
18.4 | % | 16.8 | % | 18.0 | % | 19.2 | % | 19.5 | % | 19.1 | % | 19.2 | % | ||||||||||||||
| Income from operations %(6) |
5.9 | % | 5.5 | % | 4.6 | % | 8.3 | % | 8.1 | % | 8.4 | % | 7.9 | % | ||||||||||||||
19
| Fiscal Year |
As of | |||||||||||||||||||
| October 5, 2003 | ||||||||||||||||||||
| 1998 |
1999 |
2000 |
2001 |
2002 |
||||||||||||||||
| (unaudited) | ||||||||||||||||||||
| Balance Sheet Data(2): |
||||||||||||||||||||
| Cash and cash equivalents |
$ | 5,645 | $ | 5,176 | $ | 8,317 | $ | 18,992 | $ | 4,797 | $ | 3,222 | ||||||||
| Total assets(1) |
55,338 | 70,706 | 141,184 | 154,441 | 169,626 | 202,460 | ||||||||||||||
| Long-term debt, including current portion |
57,509 | 66,120 | 78,413 | 80,088 | 39,980 | 51,543 | ||||||||||||||
| Total stockholders’ equity (deficit)(1) |
$ | (19,291 | ) | $ | (14,861 | ) | $ | 39,773 | $ | 46,978 | $ | 98,989 | $ | 111,344 | ||||||
| (1) | In May 2000, we purchased all of the outstanding capital stock of one of our franchisees, The Snyder Group Company, for approximately $23.7 million, plus liabilities assumed of $20.0 million, thereby acquiring 14 restaurants and significantly changing our capital structure. |
In addition, in May 2000, we sold 4,310,344 shares of our common stock to affiliates of Quad-C, a private equity firm, for $25.0 million. The proceeds were used to pay off debentures and promissory notes, as well as pay down bank debt and fund new restaurant construction.
| (2) | We ceased amortizing goodwill as of the beginning of 2002 in accordance with Statement of Financial Accounting Standards No. 142, “Goodwill and Other Intangible Assets.” For more detail, see Note 2 of the consolidated financial statements included elsewhere in this prospectus. |
| (3) | Net income in 1999 included a benefit for income taxes of $1.6 million and net income in 2000 included a benefit for income taxes of $12.6 million, in each case as a result of the reversal of previously recorded deferred tax asset valuation allowance. Due to our improved profitability, the deferred tax asset valuation allowance was reversed because it became more likely than not that the deferred tax asset would be realized in the future. |
| (4) | During the first quarter of 2003, we changed our method of calculating company-owned comparable restaurant sales. Under our new method, restaurants become comparable in the first period following five full quarters of operations. |
| (5) | We define restaurant-level operating profit to be restaurant sales minus restaurant operating costs, excluding restaurant closures and impairment costs. It does not include general and administrative costs, depreciation and amortization, franchise development costs and pre-opening costs. We believe that restaurant-level operating profit % is an important measure of financial performance because it is widely regarded in the restaurant industry as an important metric by which to evaluate a company’s restaurant-level operating efficiency and performance. We exclude restaurant closure costs as we believe they do not represent a component of the efficiency of continuing operations. We exclude restaurant impairment costs because, similar to depreciation and amortization, they represent a non-cash charge for our investment in the restaurant and not a component of the efficiency of the restaurant’s operations. Restaurant-level operating profit % is calculated by dividing restaurant-level operating profit by restaurant revenues. The table that follows sets forth our calculation of restaurant-level operating profit and a reconciliation to income from operations and net income, directly comparable measures under GAAP. Restaurant-level operating profit % is not a measurement determined in accordance with GAAP and should not be considered in isolation or as an alternative to income from operations or net income as indicators of financial performance. Restaurant-level operating profit % as presented may not be comparable to other similarly titled measures of other companies. |
| Fiscal Year Ended |
Forty Weeks Ended | |||||||||||||||||||||||||
| October 6, 2002 |
October 5, 2003 | |||||||||||||||||||||||||
| 1998 |
1999 |
2000 |
2001 |
2002 |
||||||||||||||||||||||
| (unaudited) | ||||||||||||||||||||||||||
| Restaurant revenues |
$ | 110,953 | $ | 121,430 | $ | 180,414 | $ | 214,963 | $ | 265,518 | $ | 201,878 | $ | 240,468 | ||||||||||||
| Restaurant Operating Costs: |
||||||||||||||||||||||||||
| Cost of sales |
27,679 | 30,159 | 43,945 | 50,914 | 61,084 | 46,689 | 56,452 | |||||||||||||||||||
| Labor |
39,089 | 43,504 | 64,566 | 74,854 | 94,030 | 72,059 | 85,117 | |||||||||||||||||||
| Operating |
17,382 | 19,429 | 27,960 | 33,195 | 40,428 | 30,587 | 36,362 | |||||||||||||||||||
| Occupancy |
6,379 | 7,998 | 11,519 | 14,785 | 18,095 | 13,955 | 16,376 | |||||||||||||||||||
| Restaurant-level operating profit |
20,424 | 20,340 | 32,424 | 41,215 | 51,881 | 38,588 | 46,161 | |||||||||||||||||||
| Add — Other Revenues |
7,262 | 8,582 | 8,756 | 9,522 | 8,892 | 6,965 | 7,336 | |||||||||||||||||||
| Deduct — Other Operating Expenses: |
||||||||||||||||||||||||||
| Restaurant closures and impairment |
140 | (330 | ) | 1,302 | 36 | 1,133 | — | — | ||||||||||||||||||
| Depreciation and amortization |
5,008 | 5,394 | 8,237 | 10,491 | 12,883 | 9,417 | 12,110 | |||||||||||||||||||
| General and administrative |
13,578 | 13,434 | 17,116 | 16,845 | 20,260 | 15,081 | 17,150 | |||||||||||||||||||
| Franchise development |
1,982 | 2,508 | 3,386 | 3,704 | 3,256 | 2,655 | 2,180 | |||||||||||||||||||
| Pre-opening costs |
— | 771 | 2,506 | 921 | 1,879 | 1,610 | 2,414 | |||||||||||||||||||
| Gain on lease buy-out |
— | — | — | — | (945 | ) | (945 | ) | — | |||||||||||||||||
| Impairment of property held for sale |
— | — | — | — | 150 | 150 | — | |||||||||||||||||||
| Total Other Operating Expenses |
20,708 | 21,777 | 32,547 | 31,997 | 38,616 | 27,968 | 33,854 | |||||||||||||||||||
| Income from operations |
6,978 | 7,145 | 8,633 | 18,740 | 22,157 | 17,585 | 19,643 | |||||||||||||||||||
| Deduct — Other expenses, net |
||||||||||||||||||||||||||
| Total other expenses |
4,773 | 4,361 | 5,759 | 7,294 | 9,812 | 8,986 | 2,351 | |||||||||||||||||||
| Provision (benefit) for income taxes |
(33 | ) | (1,596 | ) | (12,557 | ) | 3,722 | 4,081 | 3,002 | 5,751 | ||||||||||||||||
| Total — Other Operating Expenses |
4,740 | 2,765 | (6,798 | ) | 11,016 | 13,893 | 11,988 | 8,102 | ||||||||||||||||||
| Net income |
$ | 2,238 | $ | 4,380 | $ | 15,431 | $ | 7,724 | $ | 8,264 | $ | 5,597 | $ | 11,541 | ||||||||||||
| (6) | Income from operations % is determined by dividing Income from operations per our accompanying financial statements presented in accordance with GAAP by total revenues. |
20
MANAGEMENT’S DISCUSSION AND ANALYSIS OF
FINANCIAL CONDITION AND RESULTS OF OPERATIONS
The following discussion and analysis of our financial condition and results of operations should be read in conjunction with our financial statements and related notes. This discussion and analysis contains forward-looking statements that involve risks and uncertainties. Our actual results could differ materially from those anticipated in these forward-looking statements as a result of certain factors including, but not limited to, those discussed in “Risk Factors” and elsewhere in this prospectus.
Overview
We currently own and operate 113 casual dining restaurants under the name “Red Robin® America’s Gourmet Burgers & Spirits®” in 14 states and have 103 additional restaurants operating under franchise or license agreements in 18 states and two Canadian provinces. We have opened 16 new company-owned restaurants in the current year and we intend to open an additional two company-owned restaurants during the remainder of the year, for a total of 18 new restaurants for 2003. We also assumed operations of an existing franchise restaurant during the first quarter of 2003. Nine new franchise restaurants have opened in the current year and we believe our franchisees will open one additional restaurant during the remainder of the year, for a total of ten new franchise restaurants for 2003. For 2004, we expect to open 20 to 22 new company-owned restaurants and we believe our franchisees will open 14 to 16 new restaurants.
Financial definitions
Revenues. Our revenues are comprised of restaurant sales, franchise royalties and fees and rent. Our restaurant sales are comprised almost entirely of food and beverage sales. Our franchise royalties and fees consist primarily of royalty income and initial franchise fees. Rent revenue is comprised of rents received from leasing properties to franchisees and others.
Cost of sales; labor; operating; and occupancy. Cost of sales is comprised of food and beverage expenses. The components of cost of sales are variable and increase with sales volume. Labor costs include direct hourly and management wages, bonuses, taxes and benefits for restaurant team members. Operating and occupancy costs include restaurant supplies, marketing costs, fixed rent, percentage rent, common area maintenance charges, utilities, real estate taxes, repairs and maintenance and other related costs. Our operating and occupancy costs generally increase with sales volume but decline as a percentage of restaurant sales.
Depreciation and amortization. Depreciation and amortization includes depreciation on capital expenditures as well as amortization of intangible assets including franchise rights and liquor licenses.
General and administrative. General and administrative costs include all corporate and administrative functions that support existing operations and provide infrastructure to facilitate our future growth. Components of this category include management, supervisory and staff salaries, bonuses and related employee benefits, travel, information systems, training, corporate rent, professional and consulting fees and marketing costs.
Franchise development. Franchise development costs include corporate and administrative costs that support franchise operations, including menu development, site selection and prototype plans for new restaurants, marketing services and analysis, franchise team member training, equipment and food purchasing and franchise bad debts. These costs also include ongoing franchise site visits, meetings and conferences, financial studies and analysis and other operational assistance as necessary.
Pre-opening costs. Pre-opening costs, which are expensed as incurred, consist of the costs of hiring and training the initial work force, travel, the cost of food and beverages used in training, marketing costs and other direct costs related to the opening of a new restaurant.
21
Comparable restaurant sales. During first quarter 2003, we changed our method of calculating company-owned comparable restaurant sales. Under our new method, restaurants become comparable in the first period following five full quarters of operations. Prior to this change, our restaurants became comparable in the first period following the first full year of operations. We believe the new method of calculating comparable restaurant sales is a more meaningful measure given our accelerated new restaurant unit growth, and that our new methodology is more in line with industry practice.
In addition, the ten restaurants that we acquired from two franchisees during the first quarter of 2002 have been included as comparable restaurants for our forty weeks ended October 5, 2003. Company-owned comparable restaurant sales for the third quarter of 2003, excluding the ten acquired restaurants, would have increased 6.3% over third quarter 2002.
During third quarter 2003, we had 88 company-owned comparable restaurants.
The following table presents the percentage change in company-owned comparable restaurant sales for the past six quarters and full-year 2002 over the comparable prior year period, assuming that our new method of calculating company-owned comparable restaurant sales had been in effect during each of the periods presented, as well as a comparison to the previously reported results under our old method:
| 2002 |
2003 |
||||||||||||||||||||
| Method |
Q2 |
Q3 |
Q4 |
2002 |
Q1 |
Q2 |
Q3 |
||||||||||||||
| New method |
2.8 | % | 1.4 | % | 2.4 | % | 1.8 | % | 2.1 | % | 3.6 | % | 6.0 | % | |||||||
| Old method |
2.8 | % | 1.4 | % | 2.3 | % | 1.6 | % | 2.1 | % | 3.6 | % | 6.2 | % | |||||||
Critical accounting policies and estimates
The preparation of our consolidated financial statements requires us to make estimates and assumptions that affect the reported amounts of assets and liabilities and disclosure of contingent assets and liabilities at the date of the financial statements and the reported amounts of revenues and expenses during the reporting period. The estimates and assumptions are evaluated on an ongoing basis and are based on historical experience and on various other factors that are believed to be reasonable.
We believe that the application of the following accounting policies, which are important to our financial position and results of operations, requires significant judgments and estimates on the part of management. For a summary of all of our accounting policies, including the accounting policies discussed below, see Note 1 of our Notes to Consolidated Financial Statements included in this prospectus.
Accounts significantly impacted by estimates and assumptions include, but are not limited to, franchise receivables, allowances for doubtful accounts, assets held for sale, fixed asset lives, valuation of long-lived assets, impairment of goodwill and other intangible assets, income taxes, self-insurance and workers’ compensation reserves and closed restaurant reserves.
We believe that the following represent our more critical accounting policies and estimates used in the preparation of our consolidated financial statements, although not all-inclusive.
Valuation of long-lived assets
Management assesses for impairment both those assets for which management has committed to a plan of disposal and long-lived assets to be held and used in continuing operations whenever events or changes in circumstances indicate that the carrying amount may not be recoverable. We perform this assessment on a restaurant-by-restaurant basis and will recognize an impairment loss when we believe the sum of undiscounted
22
expected future cash flows is less than the carrying amount of such assets. The measurement for such an impairment loss is then based on the fair value of the asset as determined by discounted cash flows or appraisals, if available.
Revenue recognition — franchise operations
We typically grant franchise rights to private operators for a term of 20 years, with the right to extend the term for an additional ten years if certain conditions are satisfied. We provide management expertise, training, pre-opening assistance and restaurant operating assistance in exchange for area development fees, franchise fees, license fees and royalties of 3.0% to 4.0% of the franchised restaurant’s adjusted sales. Under our current form of area development agreement, we collect a $10,000 development fee for each restaurant the franchisee agrees to develop at the time we enter into the area development agreement. When a franchisee opens a new restaurant, we collect an additional $25,000 fee and we credit the $10,000 previously collected and recognize a $35,000 franchise fee as income. We may charge lower development fees and franchise fees for existing franchisees. Franchise fee revenue is recognized when all material obligations of and initial services to be provided by us have been performed, generally upon the opening of the restaurant. Until earned, these fees are accounted for as deferred revenue, a liability. Area franchise fees are dependent upon the number of restaurants in the territory as are our obligations under the area franchise agreement. Consequently, as our obligations are met, area franchise fees are recognized proportionately with the opening of each new restaurant.
Royalties are accrued as earned, and are calculated each period based on the reporting franchisee’s adjusted sales. However, if collection is not reasonably certain, we do not recognize royalty income until cash is received.
Income Taxes
We recognize estimated deferred tax liabilities and assets for the future consequences of events that have been recognized in the consolidated financial statements or tax returns. In the event the future consequences of differences between financial reporting bases and tax bases of the assets and liabilities result in a deferred tax asset, an evaluation is made of the probability of being able to realize the future benefits indicated by such asset. A valuation allowance related to a deferred tax asset is recorded when it is more likely than not that some portion or all of the deferred tax asset will not be realized. Measurement of the deferred items is based on enacted tax laws.
Our effective tax rate differs from the federal statutory rate as a result of state income taxes, general business and other tax credits, changes in deferred tax asset valuation allowances and because certain expenses deductible for financial reporting purposes are not deductible for tax purposes. In determining state income tax rates and allowable FICA tip credits, we make estimates of projected taxable income per state and of total tips that will be reported by our employees. Our estimates are made based on the best available information at the time our tax provision is prepared.
Property and Equipment
Property and equipment are recorded at cost. Expenditures for major additions and improvements are capitalized, and minor replacements, maintenance and repairs are charged to expense as incurred. Depreciation is computed on the straight-line method for financial reporting purposes, based on the shorter of the estimated useful lives or the terms of the underlying leases of the related assets. We use other depreciation methods, generally accelerated, for tax purposes where appropriate. We capitalize interest incurred on funds used to construct property and equipment. Capitalized interest is recorded as part of the asset to which it relates and is amortized over the asset’s estimated useful life. Depreciation expense represents an estimate of the decline in usefulness of assets. We believe that the estimated useful lives we assign to our assets result in an accurate allocation of depreciation expense during the periods benefited by use.
23
Closed Restaurant Reserves
Historically, we recorded a closed restaurant reserve when a decision was made to close a restaurant. The reserve principally consisted of estimated real estate brokerage costs for sales of owned property and lease termination fees and lease commitments post closing up to the date of sublease for leased properties. Our adoption of SFAS No. 146, which was effective as of the beginning of 2003, changed the manner in which we account for future restaurant closures. SFAS No. 146 changes the timing of expense recognition for certain costs incurred while closing restaurants or undertaking other exit or disposal activities; however, the timing difference is not typically significant in length. SFAS No. 146 also establishes that fair value is the objective for initial measurement of the liability. Adoption of SFAS No. 146 did not have an impact on our financial statements for the forty weeks ended October 5, 2003, because we have not had any exit or disposal activities that would be subject to the provisions of SFAS No. 146.
Allowance for doubtful accounts
Our trade accounts receivable are comprised principally of amounts due from our franchisees and landlords. With respect to accounts receivable, we attempt to limit our credit risk by performing ongoing credit evaluations and, when deemed necessary, we require letters of credit, guarantees or collateral. Regardless of the diligence exercised in extending credit, there are always some franchisees that do not pay their accounts; however, we do not believe significant risk exists in connection with our accounts receivable. We use the allowance method to account for uncollectible accounts receivable and an estimate is made of the amount of accounts receivable expected to become uncollectible. Our estimate is based on historical collection experience and a review of the current status of our accounts receivable.
24
Results of Operations
Our operating results for all periods presented below are expressed as a percentage of total revenues, except for the components of restaurant operating costs, which are expressed as a percentage of restaurant sales:
| Fiscal Year |
Forty Weeks Ended |
||||||||||||||
| October 6, 2002 |
October 5, 2003 |
||||||||||||||
| 2000 |
2001 |
2002 |
|||||||||||||
| (unaudited) | |||||||||||||||
| Revenues: |
|||||||||||||||
| Restaurant |
95.4 | % | 95.8 | % | 96.8 | % | 96.7 | % | 97.0 | % | |||||
| Franchise royalties and fees |
4.3 | 4.0 | 3.1 | 3.2 | 2.9 | ||||||||||
| Rent revenue |
0.3 | 0.2 | 0.1 | 0.1 | 0.1 | ||||||||||
| Total revenues |
100.0 | 100.0 | 100.0 | 100.0 | 100.0 | ||||||||||
| Costs and Expenses: |
|||||||||||||||
| Restaurant operating costs: |
|||||||||||||||
| Cost of sales |
24.4 | 23.7 | 23.0 | 23.1 | 23.5 | ||||||||||
| Labor |
35.8 | 34.8 | 35.4 | 35.7 | 35.4 | ||||||||||
| Operating |
15.5 | 15.4 | 15.2 | 15.2 | 15.1 | ||||||||||
| Occupancy |
6.4 | 6.9 | 6.8 | 6.9 | 6.8 | ||||||||||
| Restaurant closures and impairment |
0.7 | — | 0.4 | — | — | ||||||||||
| Total restaurant operating costs |
82.8 | 80.8 | 80.8 | 80.9 | 80.8 | ||||||||||
| Depreciation and amortization |
4.4 | 4.7 | 4.7 | 4.5 | 4.9 | ||||||||||
| General and administrative |
9.0 | 7.5 | 7.4 | 7.2 | 6.9 | ||||||||||
| Franchise development |
1.8 | 1.6 | 1.2 | 1.3 | 0.9 | ||||||||||
| Pre-opening costs |
1.3 | 0.4 | 0.7 | 0.8 | 1.0 | ||||||||||
| Gain on lease buy-out |
— | — | (0.3 | ) | (0.5 | ) | — | ||||||||
| Impairment of real estate held for sale |
— | — | 0.1 | 0.1 | — | ||||||||||
| Income from operations |
4.6 | 8.3 | 8.1 | 8.4 | 7.9 | ||||||||||
| Other (Income) Expense: |
|||||||||||||||
| Interest expense |
3.4 | 3.5 | 2.1 | 2.3 | 0.9 | ||||||||||
| Interest income |
(0.4 | ) | (0.3 | ) | (0.1 | ) | (0.1 | ) | (0.1 | ) | |||||
| Loss on extinguishment of debt |
— | — | 1.6 | 2.1 | 0.1 | ||||||||||
| Other |
— | 0.1 | — | — | — | ||||||||||
| Total other expenses |
3.0 | 3.2 | 3.6 | 4.3 | 0.9 | ||||||||||
| Income before income taxes |
1.5 | 5.1 | 4.5 | 4.1 | 7.0 | ||||||||||
| Provision for income taxes |
6.6 | (1.7 | ) | (1.5 | ) | (1.4 | ) | (2.3 | ) | ||||||
| Net income |
8.2 | % | 3.4 | % | 3.0 | % | 2.7 | % | 4.7 | % | |||||
25
Forty weeks ended October 5, 2003 compared to forty weeks ended October 6, 2002
Total revenues. Total revenues increased by $39.0 million, or 18.7%, to $247.8 million in the forty weeks ended October 5, 2003, from $208.8 million in the forty weeks ended October 6, 2002, due primarily to a $38.6 million increase in restaurant sales. The increase in restaurant sales was due to $16.6 million of sales from 13 new restaurants opened during the forty weeks ended October 5, 2003 and the franchise restaurant for which we assumed operations in April 2003, $13.3 million in additional sales from the eight restaurants not considered comparable that we opened in fiscal 2002, $1.7 million related to a full forty weeks of sales for the ten restaurants we acquired from two franchisees during first quarter 2002 and $7.0 million from comparable restaurant sales increases of 3.7%. The increase in comparable restaurant sales was driven by an increase in guest counts of 3.4% and an increase in the average guest check of 0.3% compared to the forty weeks ended October 6, 2002.
Franchise royalties and fees increased $284,300, or 4.3%, in the forty weeks ended October 5, 2003, compared to the forty weeks ended October 6, 2002, in part due to comparable U.S. franchise restaurant sales increases of 3.8%, an increase in royalties attributable to new franchise restaurants, and an increase in royalties from our Canadian franchisee, mostly attributable to more favorable foreign exchange rates. Royalties from the six new franchise restaurants opened since the end of third quarter 2002 were partially offset by the closing of three franchise restaurants during the same period and our assumption of the operations of one franchise restaurant from a former franchisee in April 2003.
Cost of sales. Cost of sales increased by $9.8 million, or 20.9%, to $56.5 million in the forty weeks ended October 5, 2003, from $46.7 million in the forty weeks ended October 6, 2002, due primarily to more restaurants being operated during the forty weeks ended October 5, 2003. Cost of sales as a percentage of restaurant sales increased 0.4%, to 23.5%, from 23.1%. Overall, the increase as a percentage of sales was attributable to increases in certain food costs during the forty weeks ended October 5, 2003, including gourmet breads, produce, pork and hamburger. In addition, we experienced a slight increase as a percentage of sales because of a shift in product mix at our comparable restaurants towards salads.
Labor. Labor expenses increased by $13.0 million, or 18.1%, to $85.1 million in the forty weeks ended October 5, 2003, from $72.1 million in the forty weeks ended October 6, 2002, due primarily to more restaurants being operated in the forty weeks ended October 5, 2003. Labor expenses as a percentage of restaurant sales decreased 0.3%, to 35.4%, from 35.7% in the forty weeks ended October 6, 2002. Overall, the improvement was due to our 3.7% increase in comparable restaurant sales combined with improvements in labor as a percentage of sales at the ten restaurants we acquired in 2002 and at our non-comparable restaurants. These improvements were partially offset by increases related to our self-insured workers’ compensation program and bonuses.
Operating. Operating expenses increased by $5.8 million, or 18.9%, to $36.4 million in the forty weeks ended October 5, 2003, from $30.6 million in the forty weeks ended October 6, 2002, due primarily to more restaurants being operated in the forty weeks ended October 5, 2003. Operating expenses as a percentage of restaurant sales decreased 0.1%, to 15.1%, from 15.2% in the forty weeks ended October 6, 2002. The improvement as a percentage of restaurant sales was due in part to our 3.7% increase in comparable restaurant sales and the discontinuance of one of our marketing funds midway through first quarter 2003 for which we had previously contributed 0.3% of restaurant sales. These improvements were partially offset by higher utilities, paper packaging, telecommunications charges and credit card processing fees.
Occupancy. Occupancy expenses increased by $2.4 million, or 17.4%, to $16.4 million in the forty weeks ended October 5, 2003, from $14.0 million in the forty weeks ended October 6, 2002, due primarily to more restaurants being operated in the forty weeks ended October 5, 2003. Occupancy expense as a percentage of restaurant sales decreased 0.1%, to 6.8%, from 6.9% in the forty weeks ended October 6, 2002. This improvement was due primarily to our 3.7% increase in comparable restaurant sales.
Depreciation and amortization. Depreciation and amortization increased $2.7 million, or 28.6%, to $12.1 million in the forty weeks ended October 5, 2003, from $9.4 million in the forty weeks ended October 6, 2002.
26
The increase was primarily due to additional depreciation on the ten restaurants we opened during fiscal 2002 and the addition of 13 new restaurants opened in the forty weeks ended October 5, 2003. Overall, depreciation and amortization expense as a percentage of total revenues increased 0.4%, to 4.9%, from 4.5% in the forty weeks ended October 6, 2002. The primary reason for this change is attributable to higher depreciation per restaurant on our newer restaurants.
General and administrative. General and administrative expenses increased by $2.1 million, or 13.7%, to $17.2 million in the forty weeks ended October 5, 2003, from $15.1 million in the forty weeks ended October 6, 2002. General and administrative expenses as a percentage of total revenues decreased 0.3%, to 6.9%, from 7.2% in the forty weeks ended October 6, 2002. The improvement in general and administrative expenses as a percentage of total revenues is due primarily to a decrease in advertising expenditures and to our 3.7% increase in comparable restaurant sales. In addition, we had unfilled positions that we expect to fill during the remainder of 2003 that positively impacted our results in the forty weeks ended October 5, 2003. The increase in overall expense is primarily a result of additional headcount and higher salaries and related costs attributable to operating more company-owned restaurants and to increased legal and accounting costs associated with our public company reporting requirements.
Franchise development. Franchise development expenses decreased $475,600, or 17.9%, to $2.2 million in the forty weeks ended October 5, 2003, from $2.7 million in the forty weeks ended October 6, 2002. Franchise development expenses as a percentage of total revenues decreased 0.4%, to 0.9%, from 1.3% in the forty weeks ended October 6, 2002, due primarily to several unfilled positions that we expect to fill during the remainder of 2003 and to a related reduction in other franchise development expenses, including travel and legal.
Pre-opening costs. Pre-opening costs increased $804,800, or 50.0%, to $2.4 million in the forty weeks ended October 5, 2003, from $1.6 million in the forty weeks ended October 6, 2002, due primarily to the fact that there were 13 company-owned restaurants opened during the forty weeks ended October 5, 2003, compared to nine during the forty weeks ended October 6, 2002. Pre-opening costs as a percentage of total revenues increased 0.2%, to 1.0%, from 0.8% in the forty weeks ended October 6, 2002. On average, pre-opening costs for the restaurants opened in the forty weeks ended October 5, 2003 were slightly lower than the average costs we incurred for the restaurants we opened in the forty weeks ended October 6, 2002. Pre-opening costs for the forty weeks ended October 5, 2003 also included $123,000 related to a restaurant we opened shortly after the end of third quarter 2003.
Gain on lease buy-out. During second quarter 2002, we realized a non-recurring gain of $945,000 due to a landlord lease buy-out of one of our company-owned restaurants. As a result, we relocated the restaurant to a new location during June 2002.
Impairment of real estate held for sale. During the third quarter 2002, we recognized a $150,000 charge to reduce the carrying value of real estate held for sale to its estimated fair value less cost to sell. This property was sold in fourth quarter 2002 for its approximate carrying value. There were no charges for real estate held for sale during the forty weeks ended October 5, 2003.
Interest expense. Interest expense decreased by $2.5 million, or 52.0%, to $2.3 million in the forty weeks ended October 5, 2003, from $4.8 million in the forty weeks ended October 6, 2002. The decrease was due primarily to lower average borrowings outstanding and a reduction in the overall interest rate of our debt in the forty weeks ended October 5, 2003, compared to the forty weeks ended October 6, 2002. Our average borrowings decreased because net proceeds from our July 2002 initial public offering were used to repay a significant portion of our then outstanding debt.
Interest income. Interest income was $255,100 in the forty weeks ended October 5, 2003, compared to $205,000 in the forty weeks ended October 6, 2002. Results for the forty weeks ended October 5, 2003 include interest income of $230,700 from related party notes receivable partially offset by a decrease in interest income from non-affiliates of $180,600, due primarily to lower average cash balances compared to the forty weeks ended October 6, 2002.
27
Loss on extinguishment of debt. We incurred $256,800 of legal fees, prepayment penalties, loan termination fees, non-cash write-offs of unamortized debt issuance costs and other costs in the forty weeks ended October 5, 2003, as a result of the exercise of our purchase options on two properties combined with the early payoff of various equipment and real estate loans during the forty weeks ended October 5, 2003. The $4.3 million charge in the forty weeks ended October 6, 2002 was attributable to prepayment penalties of $1.9 million and a $2.4 million non-cash write-off of certain capitalized debt issuance costs resulting from our repayment of borrowings using proceeds from our initial public offering and revolving credit agreement.
Other. Other expense decreased $42,200, to $19,500 in the forty weeks ended October 5, 2003, compared to $61,700 in the forty weeks ended October 6, 2002.
Income before income taxes. As a result of the above, income before income taxes increased $8.7 million, or 101.1%, to $17.3 million in the forty weeks ended October 5, 2003, from $8.6 million in the forty weeks ended October 6, 2002.
Provision for income taxes. The provision for income taxes increased $2.7 million, or 91.5%, to $5.7 million in the forty weeks ended October 5, 2003, from $3.0 million in the forty weeks ended October 6, 2002. The increase was due primarily to increased pre-tax earnings offset by a decrease in our estimated effective income tax rate. Our effective income tax rate for the forty weeks ended October 5, 2003 was 33.3%, compared to 34.9% for the forty weeks ended October 6, 2002, due primarily to lower effective state income tax rates and higher FICA tip credits in 2003.
Net income. As a result of the above, net income increased by $5.9 million, or 106.2%, to $11.5 million in the forty weeks ended October 5, 2003, from $5.6 million in the forty weeks ended October 6, 2002.
2002 (52 Weeks) compared to 2001 (52 Weeks)
Total revenues. Total revenues increased by $49.9 million, or 22.2%, to $274.4 million in 2002, from $224.5 million in 2001, due primarily to a $50.6 million increase in restaurant sales. The increase in restaurant sales was due to $26.1 million in sales derived from ten restaurants acquired from two franchisees in the first quarter of 2002, $14.7 million of sales from ten new restaurants opened in 2002, $9.1 million in additional sales from a full year of operations for the six restaurants that we opened in 2001, and $3.3 million from comparable restaurant sales increases of 1.6%. For 2002, the increase in comparable restaurant sales was driven by an increase in guest counts of 1.4% and an increase in the average guest check of approximately 0.2% compared to 2001. These increases in restaurant sales were offset by one restaurant closure in 2002, and two restaurant closures in 2001 that contributed $2.6 million more in revenue in 2001 than in 2002. We believe that unfavorable local economic conditions originally related to a downturn in the telecommunications and technology industries continues to adversely affect sales in three of our markets, Seattle, Portland and Denver, which combined represented 45.7% of our comparable sales for 2002. For these markets, comparable restaurant sales for 2002 decreased 0.9%. Excluding these markets, comparable restaurant sales increased 3.9%.
Franchise royalties and fees decreased by $437,000, or 4.9%, to $8.6 million in 2002, from $9.0 million in 2001. During 2002, we recognized fees of $166,000 from five new franchise restaurant openings compared to the recognition of $481,000 in fees from 16 new franchise restaurant openings in 2001. In addition, franchise royalties decreased in part because, on the average, there were fewer franchise restaurants open during 2002, compared to 2001, and because 2002 comparable restaurant sales for our franchisees, upon which royalties are primarily based, declined 0.5% in the U.S. and 8.1% in Canada, compared to 2001. Our acquisition of ten franchise restaurants during the first quarter of 2002 was the primary reason that there were fewer franchise restaurants open during 2002.
Cost of sales. Cost of sales increased by $10.2 million, or 20.0%, to $61.1 million in 2002, from $50.9 million in 2001, due primarily to more restaurants being operated during 2002. Cost of sales as a percentage of
28
restaurant sales decreased 0.7%, to 23.0% in 2002, from 23.7% in 2001. This reduction in cost of sales as a percentage of restaurant sales was primarily a result of favorable commodity pricing and in part due to continuing management initiatives to reduce the cost of food and beverage products, reduce waste in our restaurants and improve margins.
Labor. Labor expenses increased by $19.2 million, or 25.6%, to $94.0 million in 2002, from $74.9 million in 2001, due primarily to more restaurants being operated during 2002. Labor expenses as a percentage of restaurant sales increased 0.6%, to 35.4% in 2002, from 34.8% in 2001. Labor increased as a percentage of sales at comparable restaurants 0.4%, from 34.5% of restaurant sales in 2001, to 34.9% in 2002. The increase as a percentage of sales at comparable restaurants was due in part to higher controllable labor and floor supervisory wages as well as increased benefit costs. We also experienced higher controllable labor, floor support, management salaries and taxes and benefits at the restaurants we opened and acquired in 2001 and 2002 when compared to labor at comparable restaurants. Labor as a percentage of restaurant sales for the 2001 and 2002 new and acquired restaurants was 38.1% in 2002.
Operating. Operating expenses increased by $7.2 million, or 21.8%, to $40.4 million in 2002, from $33.2 million in 2001, due primarily to more restaurants being operated in 2002. Operating expenses as a percentage of restaurant sales decreased to 15.2% in 2002, from 15.4% in 2001. The decrease was due primarily to utility expenses, which decreased 0.4%, to 2.6% of restaurant sales in 2002, compared to 3.0% in 2001. Utility expenses were higher all over the country in 2001, but especially in Southern California, where electricity costs were significantly higher during certain periods during 2001 compared to 2002. Excluding utilities, operating expenses as a percentage of restaurant sales increased 0.1%, to 12.6% in 2002, from 12.5% in 2001.
Occupancy. Occupancy expenses increased by $3.3 million, or 22.4%, to $18.1 million in 2002, from $14.8 million in 2001, due primarily to more restaurants being operated in 2002. Occupancy expenses as a percentage of restaurant sales decreased 0.1%, to 6.8%, from 6.9% in 2001, primarily due to the fact that our sales increased at a rate greater than the fixed component of our occupancy costs.
Restaurant closures and impairment. Loss on restaurant closures and impairment was $1.1 million in 2002 compared to $36,000 in 2001. The impairment in 2002 was a non-cash charge to fully write down all of the long-lived assets related to one restaurant, which we intend to continue operating. The loss in 2001 represented the write down of residual value related to one restaurant originally impaired in 2000.
Depreciation and amortization. Depreciation and amortization increased $2.4 million, or 22.8%, to $12.9 million in 2002, from $10.5 million in 2001. The increase was primarily due to the additional depreciation on the ten restaurants opened in 2002, six new restaurants opened during 2001, and ten restaurants acquired in the first quarter of 2002. As reported, depreciation and amortization expense as a percentage of total revenues was unchanged at 4.7% for 2002 and 2001. However, 2001 results include $1.6 million of amortization related to goodwill and other intangible assets that are no longer amortized as of the beginning of 2002. Excluding the $1.6 million of 2001 amortization charges, depreciation would have increased 0.8%, from 3.9% of sales in 2001, to 4.7% of sales in 2002. The primary reason for this change is attributable to higher depreciation per unit on our 2001 and 2002 restaurant openings.
General and administrative. General and administrative expenses increased by $3.5 million, or 20.8%, to $20.3 million in 2002, from $16.8 million in 2001. Overall, general and administrative expenses as a percentage of total revenues decreased 0.1% to 7.4% in 2002 compared to 7.5% in 2001. The increase in expense is primarily a result of additional headcount and higher salaries and related costs attributable to operating more company-owned restaurants and to increased legal and accounting costs associated with our public company reporting requirements. Restaurant operations, marketing and legal costs increased as a percentage of total revenue, whereas design and construction, human resources and accounting costs decreased as a percentage of total revenue when compared to 2001. Costs related to management information systems, purchasing and executive management were relatively unchanged as a percentage of total revenues.
29
Franchise development. Franchise development expenses decreased $448,000 to $3.3 million in 2002, from $3.7 million in 2001, and decreased 0.4% as a percentage of total revenues to 1.2% in 2002, from 1.6% in 2001. The decrease in franchise development expenses was primarily due to the fact that the franchisees opened fewer new restaurants in 2002, compared to 2001. Because we expect an increase in franchise restaurant openings in 2003, we anticipate that franchise development costs will increase during 2003.
Pre-opening costs. Pre-opening costs increased by $1.0 million to $1.9 million in 2002, from $921,000 in 2001. The increase was due primarily to opening four more restaurants in 2002 as compared to 2001. In addition, average pre-opening costs per restaurant increased approximately $28,000 for restaurants opened in 2002, compared to restaurants opened in 2001. This increase is due to the fact that during 2002 we opened a higher proportion of new restaurants in markets where we do not have significant market penetration compared to new restaurant openings in 2001. Pre-opening costs related to restaurant openings in newer markets are typically 20% higher than pre-opening costs in our more mature markets due to increased labor, training, travel and marketing supplies costs.
Gain on lease buy-out. During the second quarter of 2002, we realized a non-recurring gain of approximately $945,000 due to a landlord lease buy-out of one of our company-owned restaurants. As a result, we relocated the restaurant to a new location during June 2002. The early termination fee received of $1.4 million has been presented net of related charges of $235,600 for the disposal of property and equipment from the original restaurant that was non-transferable and other non-recurring charges associated with the relocation of $204,400.
Impairment of real estate held for sale. During the third quarter of 2002, we recognized a $150,000 charge to reduce the carrying value of real estate held for sale to its estimated fair value less cost to sell. This property was sold in the fourth quarter of 2002 for its approximate carrying value. There were no charges for impairment of real estate held for sale during 2001.
Interest expense. Interest expense decreased by $2.1 million, or 26.5%, to $5.8 million in 2002, from $7.9 million in 2001. The decrease was due primarily to lower average borrowings during 2002 compared to 2001, as well as a reduction in the overall effective interest rate of our variable rate debt.
Interest income. Interest income decreased by $348,000 to $398,000 in 2002, from $746,000 in 2001. The decrease was primarily related to lower average cash balances during 2002, compared with 2001, as well as lower average interest rates. The 2002 results include interest income of approximately $252,000 from related party notes receivable, whereas there was no related party interest income during 2001.
Loss on extinguishment of debt. During the third quarter of 2002, we incurred a $4.3 million charge attributable to prepayment penalties of $1.9 million and a $2.4 million non-cash write-off of certain capitalized debt issuance costs. These charges resulted because we used proceeds from our initial public offering, together with borrowings under our revolving credit facility to repay: $45.9 million outstanding under our Finova term loan; $5.0 million outstanding under our revolving credit facility with U.S. Bank, N.A.; $1.6 million outstanding under one real estate loan; and $0.4 million outstanding under three equipment loans. We early adopted SFAS No. 145 in the second quarter of 2002 and consequently did not classify the loss on extinguishment of debt as an extraordinary item.
Other. Other expense was approximately $8,000 for 2002, compared to other expense of approximately $190,000 in 2001. Other expense principally includes holding costs associated with real estate held for sale.
Income before income taxes. As a result of the above, income before income taxes increased $898,000, or 7.8%, to $12.3 million in 2002, from $11.4 million in 2001.
30
Provision for income taxes. The provision for income taxes increased to $4.1 million in 2002, from $3.7 million in 2001. The increase is due to the $898,000 increase in income before income taxes as well as change in our effective tax rate from 32.5% for 2001 to 33.1% for 2002.
Net income. As a result of the above, net income increased by $539,000, or 7.0%, to $8.3 million in 2002, from $7.7 million in 2001.
2001 (52 Weeks) compared to 2000 (53 Weeks)
Total revenues. Total revenues increased by $35.3 million, or 18.7%, to $224.5 million in 2001 from $189.2 million in 2000 due to a $34.6 million increase in restaurant sales and a $765,000 increase in franchise and other revenues. The increase in restaurant sales was due to $17.6 million in additional sales from a full year of operations for the 15 restaurants that opened in 2000, $15.7 million in restaurant sales from a full year of operations for the 13 remaining restaurants we acquired from The Snyder Group Company in 2000, $6.7 million in sales derived from the six restaurants opened in 2001 and $2.5 million from comparable company-owned restaurant sales increases of 2.0%. This increase in restaurant sales was offset by two restaurant closures in 2001 and two restaurant closures in 2000 that contributed an additional $3.7 million more in revenue in 2000 than in 2001. The increase in restaurant sales was also offset by the impact of one additional week of sales in 2000 that contributed $4.3 million of revenue in 2000. The increase in comparable company-owned restaurant sales was driven primarily by an increase in the average guest check of approximately 2.3% compared to 2000, which was partially offset by a 0.3% decrease in guest counts. Franchise royalties and fees growth was due to 16 new franchise restaurants that opened in 2001 and a full year of operations for the ten franchise restaurants that opened in 2000.
Cost of sales. Cost of sales increased by $7.0 million, or 15.9%, to $50.9 million in 2001 from $43.9 million in 2000 due primarily to more restaurants being operated in 2001. Cost of sales as a percentage of restaurant sales decreased to 23.7% in 2001 from 24.4% in 2000. This reduction in cost of sales as a percentage of restaurant sales was primarily a result of management initiatives to reduce the cost of food and beverage products and improve margins. The reduction of food and beverage costs was achieved by lowering product cost through favorable price changes, entering into more favorable long-term contracts and decreasing waste in the restaurants.
Labor. Labor expenses increased by $10.3 million, or 15.9%, to $74.9 million in 2001 from $64.6 million in 2000 due primarily to more restaurants being operated in 2001. Labor expenses as a percentage of restaurant sales decreased to 34.8% in 2001 from 35.8% in 2000. The decrease in labor as a percentage of restaurant sales was primarily due to management focus and the use of new tools to reduce excessive staffing levels, particularly at the new restaurants opened in 2000 and 2001. Labor as a percentage of restaurant sales for the 2000 and 2001 new restaurants averaged 38.1% in 2001. This reduction was achieved despite minimum wage increases in 2001 in Washington and California that increased our average hourly wage.
Operating. Operating expenses increased by $5.2 million, or 18.7%, to $33.2 million in 2001 from $28.0 million in 2000 due primarily to more restaurants being operated in 2001. Operating expenses as a percentage of restaurant sales decreased to 15.4% in 2001 from 15.5% in 2000. Utility expenses were 3.1% of restaurant sales in 2001, 0.8% higher than 2000. Utility expenses were higher all over the country, but especially in Southern California, where electricity costs were significantly higher during certain periods in 2001 compared to 2000. To offset these uncontrollable increases, we were able to lower service and maintenance costs 0.5% through managing repairs, maintenance and service contracts more closely. We also lowered supply costs.
Occupancy. Occupancy expenses increased by $3.3 million, or 28.4%, to $14.8 million in 2001 from $11.5 million in 2000 due primarily to more restaurants being operated in 2001. Occupancy expenses as a percentage of sales increased to 6.9% in 2001 from 6.4% in 2000, primarily from higher occupancy expenses on new restaurants opened in 2001.
31
Restaurant closures and impairment. Loss on restaurant closures and impairment decreased by $1.3 million to $36,000 in 2001 from $1.3 million in 2000. The loss in 2000 was due to the write down of one under performing restaurant. The loss in 2001 represented residual write down of value related to this restaurant.
Depreciation and amortization. Depreciation and amortization increased $2.3 million, or 27.4%, to $10.5 million in 2001 from $8.2 million in 2000. The increase was primarily due to the additional depreciation on 15 new restaurants opened during 2000, additional depreciation on 13 restaurants acquired in 2000 and operated for a full year in 2001 and six new restaurants opened in 2001.
General and administrative. General and administrative expenses decreased by $271,000, or 1.6%, to $16.8 million in 2001 from $17.1 million in 2000. We had lower general and administrative expenses in 2001 due to a reduction in the number of managers in training from 2000. General and administrative expenses as a percentage of total revenues decreased to 7.5% in 2001 from 9.0% in 2000. This decrease was primarily a result of increasing the number of our restaurants without proportionately increasing general and administrative costs or administrative personnel.
Franchise development. Franchise development expenses increased $318,000 to $3.7 million in 2001 from $3.4 million in 2000 but decreased as a percentage of total revenues to 1.6% in 2001 from 1.8% in 2000. The increase in franchise development expenses was due to franchisees opening 16 new restaurants in 2001 compared to opening ten restaurants in 2000.
Pre-opening costs. Pre-opening costs decreased by $1.6 million to $921,000 in 2001 from $2.5 million in 2000. The decrease was due to opening six new restaurants in 2001 compared to opening 15 restaurants in 2000. Pre-opening costs per restaurant decreased to $154,000 in 2001, or 7.8%, from $167,000 in 2000. This decrease was primarily due to opening restaurants in established markets, thereby incurring lower travel costs for trainers.
Interest expense. Interest expense increased by $1.4 million, or 21.1%, to $7.9 million in 2001 from $6.5 million in 2000. The increase was primarily a result of new debt issued to GE Capital Corporation in 2001 for restaurants built in both 2001 and 2000, as well as higher interest rates under our credit facility with Finova Capital Corporation beginning in September 2000.
Interest income. Interest income increased by $4,000 to $746,000 from $742,000 in 2000. Interest income as a percentage of total revenues was 0.3% in 2001 and 0.4% in 2000.
Other expense. Other expense, which principally includes holding costs associated with real estate held for sale, increased $171,000, to $190,000 in 2001 from $19,000 in 2000.
Income before income taxes. Income before income taxes increased $8.6 million, or 298.3%, to $11.4 million in 2001 from $2.9 million in 2000 due to increased sales and proportionately lower operating and general and administrative costs.
(Provision) benefit for income taxes. Income tax expense in 2001 was 32.5% of income before income taxes. In 2000, we realized a significant tax benefit due to the reversal of $13.1 million of valuation allowances previously provided against deferred tax assets. These valuation allowances were recorded in prior years when we were not profitable. Upon returning to profitability, we reversed these valuation allowances. This resulted in a tax benefit of $12.6 million in 2000 compared to a tax expense of $3.7 million in 2001.
Net income. Net income decreased by $7.7 million, or 50.0%, to $7.7 million in 2001 from $15.4 million in 2000. Net income as a percentage of total revenues decreased to 3.4% in 2001 from 8.2% in 2000. The decrease was due primarily to the income tax benefit of $12.6 million in 2000 and the income tax expense of $3.7 million in 2001. This tax effect was offset by an increase in income before income taxes of $8.6 million.
32
Potential fluctuations in quarterly results and seasonality
Our quarterly operating results may fluctuate significantly as a result of a variety of factors, including:
| • | the timing of new restaurant openings and related expenses; |
| • | restaurant operating costs for our newly-opened restaurants, which are often materially greater during the first several months of operation than thereafter, and pre-opening costs; |
| • | labor availability and costs for hourly and management personnel; |
| • | profitability of our restaurants, especially in new markets; |
| • | franchise development costs; |
| • | increases and decreases in comparable restaurant sales; |
| • | impairment of long-lived assets, including goodwill, and any loss on restaurant closures; |
| • | changes in borrowing and interest rates; |
| • | general economic conditions; |
| • | changes in consumer preferences and competitive conditions; |
| • | fluctuations in food and commodity prices; and |
| • | fluctuations in costs attributable to public company compliance costs, including Sarbanes-Oxley Act related costs. |
Our business is also subject to seasonal fluctuations. Historically, sales in most of our restaurants have been higher during the summer months and winter holiday season. As a result, our quarterly and annual operating results and comparable restaurant sales may fluctuate significantly as a result of seasonality and the factors discussed above. Accordingly, results for any one quarter are not necessarily indicative of results to be expected for any other quarter or for any year and comparable restaurant sales for any particular future period may decrease. In the future, operating results may fall below the expectations of securities analysts and investors. In that event, the price of our common stock would likely decrease.
Liquidity and capital resources
Our primary liquidity and capital requirements have been for new restaurant construction, working capital and general corporate needs. In July 2002, we completed an initial public offering of 5,038,000 shares of common stock, of which we sold 4,000,000 shares, at a price to the public of $12.00 per share. The remaining 1,038,000 shares were offered by selling stockholders. We received proceeds of $42.8 million from the initial public offering, net of $3.4 million of underwriting fees and commissions and $1.8 million of other offering costs which were charged directly to additional paid-in capital as a reduction of the related proceeds. In July 2002, we also entered into a three-year $40.0 million revolving credit agreement to fund construction and acquisition of new restaurants, to refinance existing indebtedness and for general corporate purposes, including working capital.
Net proceeds from our initial public offering, together with borrowings under our revolving credit facility were used to repay: $48.0 million outstanding under our existing term loan, including $0.3 million of accrued interest and a prepayment penalty of $1.8 million; $5.0 million outstanding under our revolving credit facility with U.S. Bank; $1.6 million outstanding under one real estate loan, including a 1.0% prepayment penalty; and $0.4 million outstanding under three equipment loans.
On May 20, 2003, we amended our three-year $40.0 million revolving credit facility. Under the amended terms of the credit agreement, our borrowing capacity was increased from $40.0 million to $85.0 million. In addition, the term of the credit agreement was extended and will now expire on May 19, 2006.
33
The revolving credit facility is secured by a first priority pledge of all of the outstanding capital stock of our subsidiaries and a first priority lien on substantially all of our tangible and intangible assets. Borrowings under our revolving credit facility bear interest at one of the following rates we select: an Alternate Base Rate (ABR), which is based on the Prime Rate plus 1.0% to 1.75%, or a London Interbank Offered Rate (LIBOR), which is based on the relevant one, two, three or six month LIBOR, at our discretion, plus 2.0% to 2.75%. The spread, or margin, for ABR and LIBOR loans is adjusted quarterly based on our then current leverage ratio. Interest payments on ABR loans are due the last day of each March, June, September and December and on the maturity date. Interest payments on LIBOR loans having an interest period of three months or less are due the last day of such interest period. Interest payments on LIBOR loans having an interest period longer than three months are due every three months after the first day of the interest period and the last day of such interest period. In addition, we may borrow up to $3.0 million under a swingline loan subfacility if the sum of the outstanding ABR and LIBOR loans, swingline loans and letters of credit do not exceed $85.0 million. Swingline loans bear interest at a per annum rate equal to the prime rate plus 1.0% to 1.75%. As of October 5, 2003, borrowings outstanding under our revolving credit agreement facility bore interest at approximately 3.4%.
The revolving credit facility requires that on the last day of each fiscal quarter, we comply with a maximum leverage ratio, as defined in the revolving credit facility, of 1.75 to 1.0, as well as a minimum fixed charge coverage ratio, as defined in the revolving credit facility, of 1.25 to 1.0. The revolving credit facility also requires that on the last day of each fiscal quarter, we have earnings before interest, taxes, depreciation and amortization, or EBITDA, as further defined in the revolving credit facility, greater than or equal to the following amounts:
| Period |
Amount | ||
| May 20, 2003 through and including December 28, 2003 |
$ | 32,000,000 | |
| December 29, 2003 through and including December 26, 2004 |
$ | 34,000,000 | |
| December 27, 2004 and thereafter |
$ | 36,000,000 | |
Further, the revolving credit facility requires that on the last day of each fiscal quarter, EBITDA, as defined in the revolving credit facility, will not be less than EBITDA, as defined in the revolving credit facility, for a specified prior period multiplied by 0.90.
The revolving credit facility also requires that capital expenditures, as defined in the revolving credit facility, will not exceed the following amounts for each annual period as set forth below:
| Fiscal Year |
Amount | ||
| 2003 2004 2005 2006 |
$ $ $ $ |
58,000,000 63,000,000 75,000,000 75,000,000 | |
However, to the extent the above limitations are not exceeded, any unused amount up to $10,000,000 in any fiscal year is able to be carried forward to the immediate succeeding year and will increase the limit in the succeeding year by such carry-forward amount.
The revolving credit facility also requires that we may not enter into or assume any obligations for the payment of rent under operating leases which (a) with respect to all new restaurants opened in each fiscal year in the aggregate would exceed (i) $2,000,000 during 2003, (ii) $2,500,000 in 2004, (iii) $2,500,000 in 2005 and (iv) $2,500,000 in 2006 and (b) permit the obligations with respect to such operating lease to increase, on a year to year basis, by more than 20%.
The revolving credit facility restricts our ability to, among other things, engage in mergers, acquisitions, joint ventures and sale-leaseback transactions, and to sell assets, incur indebtedness, make investments, create liens and pay dividends. We are currently in compliance with all covenants related to the revolving credit facility.
34
As of December 29, 2002 we had $11.0 million outstanding and as of October 5, 2003, we had $33.7 million outstanding on our revolving credit facility. In addition, as of October 6, 2003, the irrevocable letter of credit issued under our revolving credit agreement had been increased from $841,000 to $2,041,000. This letter is being maintained to back our self-insured workers’ compensation program and reduces the amount of borrowings available on our revolving credit facility. During the second quarter of 2003, we elected to prepay $3.2 million of real estate and equipment loans using borrowings from our revolving credit facility. These loans were payable monthly over remaining terms ranging from three to eight years and were subject to fixed interest rates ranging from 7.9% to 9.7%. As a result of these prepayments, we incurred loan termination fees, non-cash write-offs of unamortized debt issuance costs, and other costs totaling $106,500. We were required under our revolving credit facility to exercise the purchase options on three capital leases during 2003. These purchase options relate to our restaurant leases in Highlands Ranch, Colorado; Issaquah, Washington; and Grapevine, Texas. The exercise of the Highlands Ranch purchase option was completed in January 2003 for $4.0 million; the exercise of the Issaquah purchase option was completed in August 2003 for $3.7 million; and the exercise of our Grapevine purchase option was completed in September 2003 for $3.5 million. The exercise of these purchase options was funded with borrowings from our revolving credit facility, which further reduced the amount of borrowings available under the revolving credit agreement. As a result of the exercise of these purchase options, we incurred legal fees and prepayment penalties, non-cash write-offs of unamortized debt issuance costs, and other costs totaling $150,300, which have been included in our financial statements under “loss on extinguishment of debt.”
As of December 29, 2002 we had $11.6 million outstanding and as of October 5, 2003 we had $10.3 million outstanding under the real estate and equipment loans with GE Capital. These loans bear interest at the 30-day commercial paper rate, plus 3.5% and mature between April 1, 2005 and April 1, 2016 and are secured by buildings, equipment and improvements on certain properties. In addition, from time to time, we have entered into real estate and equipment loans with various parties, including Captec Financial Group, with interest rates ranging from 2.1% to 13.4% and having varying maturity dates. As of December 29, 2002, we had $17.4 million outstanding and as of October 5, 2003 we had $7.5 million outstanding under these real estate and equipment loans with various parties, including Captec. The GE Capital loans, together with certain of our other loans, require that we maintain a maximum debt to net worth ratio, a minimum debt coverage ratio, a minimum EBITDA ratio and a maximum funded indebtedness ratio. As of the date of this prospectus, we are in compliance with all of these financial ratios.
Cash provided by operations for the forty weeks ended October 5, 2003 increased $13.5 million, or 74.1%, to $31.6 million, compared to the forty weeks ended October 6, 2002, reflecting increased cash flow from restaurant and franchise operations of $5.1 million, lower cash payments for interest of $3.6 million, lower cash payments related to the extinguishment of debt of $1.8 million, and increased cash flow from changes in operating assets and liabilities of $8.2 million. These increases were partially offset by higher income tax payments of $2.7 million and other non-cash adjustments to net income of $2.3 million. Net cash provided by operating activities in 2002 and 2001 was $29.1 million and $25.8 million, respectively. The increase from 2001 to 2002 was a result of improved restaurant operating profits and a reduction in cash paid for interest expense, offset by a reduction in cash generated from franchise royalties and fees, rental income, and interest income combined with increases in cash paid for taxes. We also incurred prepayment penalties related to our early extinguishment of debt. Furthermore, we experienced a reduction in accounts receivable, but increases in inventories, prepaid expenses, income taxes receivable and other assets combined with increased uses of cash related to changes in liabilities compared to 2001.
Cash used in investing activities for the forty weeks ended October 5, 2003 increased $6.6 million, or 18.0%, to $43.1 million, compared to $36.5 million for the forty weeks ended October 6, 2002. During the forty weeks ended October 5, 2003, we spent $43.2 million for new restaurant construction, remodels, capital maintenance and a lease buy-out on three properties previously under capital lease. During the forty weeks ended October 6, 2002, we spent $6.3 million to acquire six restaurants from Western Franchise Development, Inc., a franchisee, $3.8 million to acquire the assets of three restaurants from another franchisee, and $26.4 million for new restaurant construction, remodels and capital maintenance. Cash used in investing activities in 2002
35
increased $28.6 million to $45.0 million, compared to $16.4 million in 2001. During 2002, we invested $35.8 million for new restaurant construction, remodels and capital maintenance, and $3.8 million to acquire the assets of three restaurants from a franchisee. During 2002, we opened ten new restaurants and relocated one restaurant for a total cost of $21.3 million, spent approximately $6.4 million on remodels and capital maintenance, incurred $7.3 million on restaurants to be opened in 2003, and $0.8 million for corporate infrastructure initiatives including information systems and computer equipment. In addition, we spent $6.3 million to acquire six restaurants from Western Franchise Development, Inc., a franchisee. Proceeds of $0.9 million in 2002 were generated mostly from the sale of one property held for sale. During 2001, we opened six new restaurants for a total cost of $9.0 million, spent approximately $4.5 million on remodels and capital maintenance, paid $1.5 million for new 2000 restaurant construction and spent $3.7 million on restaurants that opened in 2002.
Cash provided by financing activities for the forty weeks ended October 5, 2003 increased $6.3 million, or 177.6%, to $9.9 million, compared to $3.6 million for the forty weeks ended October 6, 2002. During the forty weeks ended October 5, 2003 borrowings totaled $33.3 million. Our debt repayments, using new borrowings from our revolving credit facility, totaled $23.3 million. In part, debt repayments during the forty weeks ended October 5, 2003 included $3.6 million related to the prepayment of our capital lease obligation for our restaurant property in Highlands Ranch, Colorado; $2.4 million to prepay our capital lease obligation for our restaurant property in Issaquah, Washington; and $2.3 million to prepay our capital lease obligation for our restaurant property in Grapevine, Texas. In addition, debt repayments included $3.2 million related to the prepayment of various real estate and equipment loans discussed in additional detail in Note 9 of the accompanying notes to consolidated financial statements. Other proceeds, totaling $694,100, principally related to sales of common stock. We incurred debt issuance costs during the forty weeks ended October 5, 2003 of $756,000, which related to the amendment of our revolving credit facility. On July 18, 2002, we completed an initial public offering and received net proceeds of $42.7 million from the offering. Borrowings were $18.0 million and debt repayments using new borrowings and proceeds from our initial public offering were $56.2 million. We incurred $1.4 million of debt issuance costs related to our revolving credit agreement, which is being amortized ratably over the term of the agreement. In addition, during the forty weeks ended October 6, 2002, we raised $513,600 of proceeds from the exercise of stock options. Cash provided by financing activities in 2002 increased $419,000 to $1.7 million, compared to $1.3 million in 2001. We received proceeds of $42.8 million from the initial public offering of our stock, net of $3.4 million of underwriting fees and commissions and $1.8 million of other stock issuance costs. In addition, during 2002, we received proceeds of approximately $554,000 from the exercise of stock options. Borrowings were $18.8 million and debt repayments using new borrowings and proceeds from our initial public offering were $58.9 million. We also incurred $1.5 million of debt issuance costs. During 2001, cash flows provided by financing activities were primarily attributable to $6.4 million of borrowings and $81,000 of proceeds from the sale of common stock. These proceeds were offset by $4.7 million of debt repayments and $459,000 of debt issuance costs.
Throughout the remainder of fiscal 2003, we expect to spend $10.5 million to $12.0 million to fund the construction of new restaurants and $2.0 million to $3.0 million for restaurant remodels and capital maintenance related to existing restaurants and corporate infrastructure.
We believe that anticipated cash flows from operations and funds available from our existing revolving credit facility, together with cash on hand, will provide sufficient funds to finance our expansion plans through at least the end of 2005, not taking into account the expected proceeds from this offering. Including the expected proceeds from this offering, we believe that we will be able to finance our expansion plans through the remaining term of our revolving credit agreement. Changes in our operating plans, acceleration of our expansion plans, lower than anticipated sales, increased expenses or other events may cause us to need to seek additional debt or equity financing in future periods. There can be no guarantee that financing will be available on acceptable terms, or at all, and our failure to raise capital when needed could negatively impact our growth plans and our financial condition and results of operations. Additional equity financing may be dilutive to the holders of our common stock and debt financing, if available, may involve significant cash payment obligations and covenants and/or financial ratios that restrict our ability to operate our business.
36
Contractual Obligations
The following table summarizes the amounts of payments due under specified contractual obligations as of October 5, 2003.
| Payments due by period | |||||||||||||||
| Contractual Obligations |
Total |
Less than 1 year |
1-3 years |
3-5 years |
More than 5 years | ||||||||||
| (in thousands) | |||||||||||||||
| Long-term debt obligations(1) |
$ | 45,241 | $ | 1,115 | $ | 37,822 | $ | 2,483 | $ | 3,821 | |||||
| Capital lease obligations(2) |
11,190 | 732 | 2,589 | 1,748 | 6,121 | ||||||||||
| Operating lease obligations(3) |
146,777 | 13,156 | 25,178 | 23,376 | 85,067 | ||||||||||
| Purchase obligations(4) |
$ | 29,001 | $ | 10,771 | $ | 3,119 | $ | 2,279 | $ | 12,832 | |||||
| (1) | Long-term debt obligations represent our borrowings under our revolving credit facility and other collateralized notes payable. |
| (2) | Capital lease obligations include interest of $4.9 million. |
| (3) | Operating lease obligations represent future minimum lease commitments payable for land, buildings and equipment used in our operations. The operating leases have terms ranging from one year to twenty-five years and generally contain renewal options that permit us to renew the leases at prevailing market rates. Certain equipment leases also include options to purchase equipment at the end of the lease term. The amounts presented above have not been reduced by rental income from sublease arrangements that we enter in to from time to time. |
| (4) | Purchase obligations include commitments related to the construction of new restaurants and other capital improvement projects; information technology contracts, including software licenses, maintenance and service agreements; commitments to purchase land related to new restaurants; lease commitments related to unopened company-owned restaurants; obligations under various marketing agreements or initiatives; and employment agreements for two officers. |
Quantitative and qualitative disclosures about market risk
Market risk exposures for our assets are related to our cash, cash equivalents and investments. We invest our excess cash in highly liquid short-term investments with maturities of less than one year. These investments are not held for trading or other speculative purposes. Changes in interest rates affect the investment income we earn on our investments and, therefore, impact our cash flows and results of operations.
Under our amended revolving credit facility, we are exposed to market risk from changes in interest rates on borrowings, which bear interest at one of the following rates we select: an ABR, based on the Prime Rate plus 1.0% to 1.75%, or a LIBOR, based on the relevant one, two, three or six-month LIBOR, at our discretion, plus 2.0% to 2.75%. The spread, or margin, for ABR and LIBOR loans under the revolving credit agreement are subject to quarterly adjustment based on our then current leverage ratio, as defined by the agreement.
Our objective in managing exposure to interest rate changes is to limit the impact of interest rate changes on earnings and cash flows and to lower overall borrowing costs. To achieve this objective, we may use interest rate swaps and caps to manage our net exposure to interest rate changes related to our borrowings. As appropriate, on the date derivative contracts are entered into, we designate derivatives as either a hedge of the fair value of a recognized asset or liability or of an unrecognized firm commitment (fair value hedge), or a hedge of a forecasted transaction or of the variability of cash flows to be received or paid related to a recognized asset or liability (cash flow hedge).
During 2002, we entered into a variable-to-fixed interest rate swap agreement with an effective date of January 29, 2003, which expires on January 30, 2006. The agreement has been designated as a cash flow hedge under which we will pay interest on $10.0 million of notional amount at a fixed rate plus the applicable spread of 2.0% to 2.75%, and receive interest on $10.0 million of notional amount at a variable rate. The variable rate interest received by us was initially based on the 1-month LIBOR determined two banking days prior to the effective date. Thereafter, the interest rate is reset according to the then current 1-month LIBOR determined two banking days prior to the second day of each monthly calculation period. Our objective in managing exposure to interest rate changes is to limit the impact of interest rate changes on earnings and cash flows and to lower
37
overall borrowing costs. As of October 5, 2003, the unrealized loss on derivative instruments designated and qualifying as cash flow hedging instruments that are reported in comprehensive income totaled $123,100, net of tax benefit of $73,200.
Our variable rate based loans with GE Capital bear interest at the 30-day commercial paper rate plus a fixed percentage of 3.0% to 3.5%.
As of October 5, 2003, we had $10.3 million outstanding under our GE Capital term loans, and $33.7 million outstanding under our revolving credit facility. Prior to the offsetting effects of our interest rate swap, a 1.0% change in the effective interest rate applied to these loans would have resulted in pre-tax interest expense fluctuating $440,000 on an annualized basis.
Primarily all of our transactions are conducted, and our accounts are denominated, in United States dollars. Accordingly, we are not exposed to foreign currency risk.
Many of the food products purchased by us are affected by changes in weather, production, availability, seasonality and other factors outside our control. In an effort to control some of this risk, we have entered into some fixed price purchase commitments with terms of no more than a year. In addition, we believe that almost all of our food and supplies are available from several sources, which helps to control food commodity risks.
Inflation
The primary inflationary factors affecting our operations are food and labor costs. A large number of our restaurant personnel are paid at rates based on the applicable minimum wage, and increases in the minimum wage directly affect our labor costs. Many of our leases require us to pay taxes, maintenance, repairs, insurance and utilities, all of which are generally subject to inflationary increases. We believe inflation has not had a material impact on our results of operations in recent years.
Recent Accounting Developments
We have adopted SFAS No. 146, Accounting for Costs Associated with Exit or Disposal Activities. SFAS No. 146 addresses financial accounting and reporting for costs associated with exit or disposal activities and nullifies Emerging Issues Task Force (EITF) Issue No. 94-3, Liability Recognition for Certain Employee Termination Benefits and Other Costs to Exit an Activity (including certain Costs Incurred in a Restructuring). SFAS No. 146 is effective for exit or disposal activities that are initiated after December 31, 2002. SFAS No. 146 changes the timing of expense recognition for certain costs incurred while closing restaurants or undertaking other exit or disposal activities; however, the timing difference is not typically significant in length. SFAS No. 146 also establishes that fair value is the objective for initial measurement of the liability. Adoption of SFAS No. 146 did not have an impact on our financial statements for the forty weeks ended October 5, 2003, because we did not have any exit or disposal activities that would be subject to the provisions of SFAS No. 146.
In November 2002, the FASB issued Interpretation No. 45 (FIN 45), Guarantor’s Accounting and Disclosure Requirements for Guarantees, Including Indirect Guarantees of Indebtedness of Others. FIN 45 elaborates on the existing disclosure requirements for most guarantees. It also clarifies that at the time a company issues a guarantee, it must recognize an initial liability for the fair value of the obligations it assumes under that guarantee and must disclose that information in its interim and annual financial statements. The accounting provisions of FIN 45 are effective on a prospective basis to guarantees issued or modified after December 15, 2002. The disclosure requirements of FIN 45 are effective for financial statements for periods ending after December 15, 2002. We do not have material guarantees that require disclosure under FIN 45 and adoption of its initial recognition and initial measurement provisions did not have a material impact on our consolidated financial position or results of operations.
38
In January 2003, the Financial Accounting Standards Board (FASB) issued Interpretation No. 46, Consolidation of Variable Interest Entities (FIN 46), which requires the consolidation of certain special purpose or variable interest entities. FIN 46 is applicable to financial statements issued after 2002. We have no variable interest in variable interest entities and, therefore, there are no entities that will be consolidated with our financial statements as a result of FIN 46.
In January 2003, the Emerging Issues Task Force (EITF) reached a final consensus on EITF Issue No. 02-16, Accounting by a Customer (Including a Reseller) for Certain Consideration Received from a Vendor. EITF No. 02-16 clarifies certain aspects for accounting and recording by customers of consideration received from suppliers. Under EITF No. 02-16, consideration received related to growth rebates and agreements containing specified time period restrictions should be recorded as a reduction of cost of goods sold and recognized on a systematic and rational allocation if the amounts are probable and reasonably estimable. In addition, consideration received for certain promotional activities should be recorded as a reduction of those costs, with any excess being recorded as a reduction of cost of goods sold. The application of EITF No. 02-16 has not had a material impact on our consolidated financial position or results of operations for the forty weeks ended October 5, 2003.
39
Overview
We are a casual dining restaurant chain focused on serving an imaginative selection of high quality gourmet burgers in a family-friendly atmosphere. We currently own and operate 113 casual dining restaurants under the name “Red Robin® America’s Gourmet Burgers & Spirits®” in 14 states and have 103 additional restaurants operating under franchise or license agreements in 18 states and two Canadian provinces. We have opened 16 new company-owned restaurants in the current year and we intend to open an additional two company-owned restaurants during the remainder of the year, for a total of 18 new restaurants for 2003. We also assumed operations of an existing franchise restaurant during the first quarter of 2003. Nine new franchise restaurants have opened in the current year and we believe our franchisees will open one additional restaurant during the remainder of the year, for a total of ten new franchise restaurants for 2003. For 2004, we expect to open 20 to 22 new company-owned restaurants and we believe our franchisees will open 14 to 16 new restaurants.
Our menu is centered around our signature product, the gourmet burger, which we make from beef, chicken, veggie, fish, turkey and pot roast and serve in a variety of recipes. We offer a wide selection of toppings for our gourmet burgers, including fresh guacamole, roasted green chilies, honey mustard dressing, grilled pineapple, crispy onion straws, sautéed mushrooms and a choice of six different cheeses. In addition to our gourmet burgers, which accounted for approximately 44.2% of our total food sales in 2002, we also serve an array of other food items that are designed to appeal to a broad group of guests, including salads, soups, appetizers, other entrees such as rice bowls and pasta, desserts and our signature Mad Mixology® alcoholic and non-alcoholic specialty beverages.
Our restaurants are designed to create a fun and memorable dining experience in a family-friendly atmosphere and provide our guests with an exceptional dining value. Our concept attracts a broad guest base by appealing to the entire family, particularly women, teens, kids ages eight to 12 whom we refer to as tweens, and other children. Our mascot “Red” appeals to toddlers, and our carousel horses, televisions in the floors, three dimensional art and humorous posters appeal to children of all ages. We believe that our quick meal preparation enables us to achieve high sales productivity and that our upbeat, popular music and enthusiastic team members create a sense of activity and excitement. All of our menu items are designed to be delivered to guests in a time-efficient manner, and we have a per person average check of approximately $10.00, which includes beverages.
To increase guest traffic, we locate our restaurants near high activity areas, such as retail centers, big box shopping centers and entertainment centers. We believe that women, teens and tweens are extremely attractive consumers to real estate developers in these types of locations as they often strive to attract a similar consumer base to ours. We further believe that these individuals are the primary visitors to the high activity areas where our restaurants are located and are predominantly responsible for family dining decisions. Data from an independent source indicates that in 2001 approximately 28.0% of our guests were in the highly desirable under 18 consumer segment, which compared to 20.0% in the major casual dining bar and grill chains. According to a survey we conducted in 2001, approximately 57.0% of our guests are females. We believe our unique guest demographic mix provides us with a competitive advantage over other casual dining chains, enhancing our ability to enter into real estate locations favorable to us.
We believe that the appeal of our imaginative, high quality product offerings, our fun, family-friendly atmosphere, and our ability to operate in a wide variety of real estate formats and geographic locations have created an attractive restaurant model, providing us with significant opportunities for continued growth through both new company-owned and franchised restaurants.
History
Red Robin was founded in September 1969. From September 1969 until December 1983, Red Robin operated as Red Robin Enterprises, Inc., a Washington corporation, and from December 1983 until June 1990,
40
Red Robin operated as Red Robin International, Inc., a Washington corporation. In June 1990, Red Robin reincorporated in Nevada as Red Robin International, Inc., a Nevada corporation. In 2000, we completed a recapitalization of our company to position our company for future growth. We acquired Mike Snyder’s 14-unit franchise company, The Snyder Group, in exchange for equity, cash and notes. In addition, Quad-C, a private equity firm whose principals have substantial experience in the restaurant industry, made an equity investment of $25.0 million in our company through its affiliates. As a result of these two transactions, Quad-C became our largest stockholder and Mike Snyder acquired a significant equity interest in our company. In January 2001, our management formed Red Robin Gourmet Burgers, Inc., a Delaware corporation, to facilitate a reorganization of the company. The reorganization was consummated in August 2001, and since that time, Red Robin Gourmet Burgers, Inc. has owned all of the outstanding capital stock of Red Robin International, Inc. Our business is operated primarily through Red Robin International, Inc.
In July 2002, we completed an initial public offering of 5,038,000 shares of common stock, of which we sold 4,000,000 shares, at a price to the public of $12.00 per share. The remaining 1,038,000 shares were offered by selling stockholders. We received proceeds of $42.8 million from the initial public offering, net of $3.4 million of underwriting fees and commissions and $1.8 million of other offering costs. In July 2002, we also entered into a three-year $40.0 million revolving credit agreement to fund construction and acquisition of new restaurants, to refinance existing indebtedness and for general corporate purposes, including working capital. Net proceeds from our initial public offering, together with borrowings under our revolving credit agreement were used to repay existing borrowings under our term loan and other agreements. On May 20, 2003, we amended our revolving credit facility and under the amended terms of the credit agreement, our borrowing capacity was increased from $40.0 million to $85.0 million. In addition, the term of the credit agreement was extended and will now expire on May 19, 2006.
Concept and business strategy
Our objective is to be the leading gourmet burger and casual dining restaurant destination. To achieve our objective, we have developed the following strategies.
| • | Focus on key guiding principals, or “cornerstones,” that drive our success. In managing our operations, we focus on four cornerstones that we believe are essential to our business. Our four cornerstones are: |
| — | Values. To enhance the dining experience of our guests, we strive to maintain our core values: honor, integrity, seeking knowledge and having fun. |
| — | People. We recognize that our team members are our strongest asset. We seek to hire high quality team members and provide them with comprehensive training programs to ensure that we deliver superior service to our guests. |
| — | Burgers. We strive to be the number one casual dining destination for gourmet burgers in the markets in which we operate. |
| — | Time. We believe in giving our guests the “gift of time.” Our service sequence is designed to consistently prepare every menu item in less than eight minutes, which allows guests to enjoy time-efficient lunches and dinners. We strive to provide guests with a 37-minute dining experience at lunch and 42 minutes at dinner. |
| • | Offer high quality, imaginative menu items. Our restaurants feature menu items that use imaginative toppings and showcase recipes that capture tastes and flavors that our guests do not typically associate with burgers, salads and sandwiches. We believe the success of our concept is due to our ability to interpret the latest food trends and incorporate them into our gourmet burgers, pastas, rice bowls, appetizers, salads, sandwiches and beverages. Our menu items are cooked to order, using high-quality, fresh ingredients and premium meats, and are based on unique recipes. One of our signature menu items is our Royal Red Robin Burger, which features a gourmet burger topped with a fried egg, along with bacon, cheese, lettuce, tomato and mayonnaise. We offer a wide selection of toppings for our gourmet |
41
| burgers, including fresh guacamole, roasted green chilies, honey mustard dressing, grilled pineapple, crispy onion straws, sautéed mushrooms and a choice of six different cheeses. We serve all of our gourmet burgers and sandwiches with “bottomless” French fries. |
| • | Create a fun, festive and memorable dining experience. We promote an exciting, high-energy and family-friendly atmosphere by decorating our restaurant interiors with an eclectic selection of celebrity posters, three-dimensional artwork, carousel horses and statues of our mascot “Red.” We enhance the excitement and energy levels in our restaurants by placing televisions in our main dining areas, in our floors and in our bathrooms and by playing upbeat, popular music throughout the day. |
| • | Provide an exceptional dining value with broad consumer appeal. We offer generous portions of high quality, imaginative food and beverages for a per person average check of approximately $10.00, including beverages. We believe this price-to-value relationship differentiates us from our competitors, many of whom have significantly higher average guest checks, and allows us to appeal to a broad base of consumers with a wide range of income levels. In addition to attracting families and groups, our restaurant features seating in the bar area, which is often used by our single diners. Our restaurants are popular during both the day and evening hours as evidenced by our almost equal split between lunch and dinner sales. We believe that our diverse menu further enhances our broad appeal by accommodating groups with different tastes. |
| • | Deliver strong unit economics. In 2002, our comparable company-owned restaurants generated average sales of approximately $3.0 million. The average cash investment cost for our free-standing restaurants opened in 2002 was approximately $1.7 million, excluding pre-opening costs, which averaged approximately $181,000 per restaurant, and land. |
| • | Pursue disciplined company-owned restaurant and franchise growth. We are pursuing a disciplined growth strategy, including both company-owned and franchised development. Our site selection criteria focus on identifying markets, trade areas and other specific sites that are likely to yield the greatest density of desirable demographics, heavy retail traffic and a highly visible site. In 2002, we opened ten new company-owned restaurants, acquired ten existing restaurants from two franchisees, and relocated one restaurant. In addition, our franchisees opened five new restaurants. We have opened 16 new company-owned restaurants in the current year and we have an additional two company-owned restaurants under construction that we intend to open during the remainder of the year, for a total of 18 new restaurants for 2003. We also assumed operations of an existing franchise restaurant during the first quarter of 2003. Nine new franchise restaurants have opened in the current year and we believe our franchisees will open one additional restaurant during the remainder of the year, for a total of ten new franchise restaurants for 2003. For 2004, we expect to open 20 to 22 new company-owned restaurants and we believe our franchisees will open 14 to 16 new restaurants. |
| • | Build awareness of the Red Robin® America’s Gourmet Burgers & Spirits® brand. We believe that the Red Robin name has achieved substantial brand equity among our guests and has become well known within our markets for our signature menu items. We intend to strengthen this brand loyalty by continuing to offer new menu items and deliver a consistently memorable guest experience. Additionally, we believe that Red Robin is recognized for the family-friendly, high-energy and exciting atmosphere our restaurants offer. Key brand attributes that we continue to build upon are our high-quality imaginative food items, commitment to guest service and a strong price-to-value relationship. |
| • | Continue to capitalize on favorable lifestyle and demographic trends. We believe that we have benefited from several key lifestyle and demographic trends that have helped drive our business. These trends include: |
| — | Increase in consumption of food away from home. According to an April 2002 report, the National Restaurant Association estimates that the restaurant industry captured 45.3% of all consumer dollars spent on food in 2000 and projects the restaurant industry’s share to increase to 53.0% by |
42
| 2010. Given our attractive average guest check, family-friendly atmosphere and fun, festive and memorable dining experience, we believe we are well-positioned to continue to benefit from this expected increase in food consumed away from home. |
| — | The large and growing teen population. According to a January 2000 study conducted by the United States Census Bureau, the teen segment of the population, persons 12 to 19 years old, is expected to grow 36.6% faster than the overall population from 31.6 million in 2000 to 33.6 million by 2005. Given that our concept attracts a significant number of teens and tweens, we believe we will continue to benefit from the strong growth in this segment of the population. |
We believe these and other lifestyle and demographic trends will continue to be favorable to us and offer us strong opportunities for future restaurant expansion.
Growth strategies
We believe that there are significant opportunities to grow our concept and brand on a nationwide basis through both new company-owned and franchised restaurants. We believe that our concept and brand can support more than 830 additional company-owned or franchised restaurants throughout the United States.
Company-owned restaurants
Our primary source of expansion and growth in the near term will be the addition of new company-owned restaurants. We are pursuing a disciplined growth strategy and intend to develop many of our new restaurants in our existing markets, and selectively enter into new markets. Part of our growth strategy is to cluster restaurants within existing markets, which we believe will enable us to gain operating efficiencies, increase brand awareness and enhance convenience and ease of access for our guests, all of which we believe will lead to significant repeat business. Our site selection criteria for new restaurants are flexible and allow us to adapt to a variety of locations near high activity areas such as retail centers, big box shopping centers and entertainment centers. In 2002, we opened ten new company-owned restaurants, relocated one restaurant and acquired ten existing restaurants from franchisees. We have opened 16 new company-owned restaurants during 2003 and we have an additional two company-owned restaurants under construction that we intend to open during the remainder of the year, for a total of 18 new restaurants for 2003. During 2003 we have opened new company-owned restaurants in existing markets, as well as new markets, including Omaha, Nebraska and Tulsa, Oklahoma. We also assumed operations of an existing franchise restaurant during the first quarter of 2003. For 2004, we expect to open 20 to 22 new company-owned restaurants. We have identified the sites and have entered into letters of intent or leases for all of these restaurants.
Franchised restaurants
The other key aspect of our growth strategy is the continued development of our franchise restaurants. We expect the majority of our new franchise restaurant growth to occur primarily in the Northeast, Midwest and the South. We intend to continue to strengthen our franchise system by attracting experienced and well-capitalized area developers who are quality-conscious restaurant operators and who possess the expertise and resources to execute the development of new restaurants on a large scale. Similarly, we have chosen not to pursue relationships with franchisees that would involve only a limited number of restaurants in a limited territory, because we believe that this would consume too much of our time and attention for the return we would expect to achieve. In 2002, our franchisees opened five new restaurants. Nine new franchise restaurants have opened during 2003 and we believe our franchisees will open one additional restaurant during the remainder of 2003, for a total of ten new franchise restaurants for the full year 2003. During 2003 our franchisees have opened new restaurants in existing markets, as well as new markets, including Independence, Missouri and San Antonio, Texas. For 2004, we believe our franchisees will open 14 to 16 new restaurants.
43
Unit level economics
In 2002, our comparable company-owned restaurants generated average sales of approximately $3.0 million. The typical cash investment cost for our freestanding restaurants opened in 2002 was approximately $1.7 million, excluding pre-opening costs, which averaged approximately $181,000 per restaurant, and land.
Currently, our existing restaurants range in size from 3,800 square feet to 10,700 square feet. Our prototype restaurant is typically a freestanding building with approximately 6,350 square feet, approximately 200 seats and a patio. Based on this prototype, we expect our total cash investment per restaurant will average approximately $2.1 million in 2003, excluding pre-opening costs, which we estimate to be approximately $178,500 per restaurant.
Expansion strategy and site selection
Our restaurant expansion strategy focuses primarily on further penetrating existing markets with a cluster strategy and selectively entering into new markets. This clustering approach enables us to increase brand awareness and improve our operating efficiencies. For example, clustering enables us to reduce costs associated with regional supervision of restaurant operations. We also believe this approach reduces the risks involved with opening new restaurants given that we better understand the competitive conditions, consumer tastes, demographics and discretionary spending patterns in our existing markets. In addition, our ability to hire qualified team members is enhanced in markets in which we are well known.
We believe that our site selection strategy is critical to our success and we devote substantial time and effort to evaluating each site. Our site selection criteria focus on identifying markets, trade areas and other specific sites that are likely to yield the greatest density of desirable demographic characteristics, heavy retail traffic and a highly visible site.
In order to maximize our market penetration potential, we have developed a flexible physical site format that allows us to operate in a range of real estate venues located near high activity areas such as retail centers, big box shopping centers and entertainment centers. Approved sites generally have a population of at least 70,000 people within a three-mile radius and at least 100,000 people within a five-mile radius. Sites generally require a strong daytime and evening population, adequate parking, a visible and easy entrance and exit. Our prototype restaurant is typically a freestanding building with approximately 6,350 square feet, approximately 200 seats and a patio.
Our real estate team focuses on site selection and future development and each prospective site is thoroughly analyzed before a lease or purchase agreement is signed. Prior to committing to a restaurant site, the site is thoroughly evaluated, visited and approved by our senior management team. Our chief executive officer and/or our chief financial officer personally visit and approve all new sites.
With the exception of the 16 company-owned restaurants for which we own the real estate, we operate our restaurants under leases. Our primary site objective is to secure a superior site, with the decision to buy or lease as a secondary objective. We believe that our unique guest demographic mix provides us with a major competitive advantage in securing sites. Our long-standing relationships with several major mall developers and owners and our favorable demographics afford us the opportunity to negotiate additional sites in new malls that they are developing. Our format provides us with a great deal of flexibility in these negotiations, because our concept is suitable for a wide variety of real estate venues.
44
Restaurant locations
We currently have 113 company-owned restaurants and 103 franchised restaurants in 24 states and two Canadian provinces as shown in the chart below.
| Number of Restaurants | ||||||
| Company-Owned |
Franchised |
Total | ||||
| Alaska |
— | 2 | 2 | |||
| Arizona |
5 | 3 | 8 | |||
| California |
35 | 16 | 51 | |||
| Colorado |
16 | — | 16 | |||
| Idaho |
— | 3 | 3 | |||
| Illinois |
— | 5 | 5 | |||
| Indiana |
1 | — | 1 | |||
| Maryland |
5 | — | 5 | |||
| Michigan |
— | 9 | 9 | |||
| Minnesota |
— | 3 | 3 | |||
| Missouri |
3 | 1 | 4 | |||
| Montana |
— | 1 | 1 | |||
| Nebraska |
3 | — | 3 | |||
| Nevada |
3 | 1 | 4 | |||
| New Mexico |
— | 2 | 2 | |||
| Ohio |
7 | 1 | 8 | |||
| Oklahoma |
1 | — | 1 | |||
| Oregon |
11 | 3 | 14 | |||
| Pennsylvania |
1 | 8 | 9 | |||
| Texas |
— | 6 | 6 | |||
| Utah |
— | 4 | 4 | |||
| Virginia |
5 | — | 5 | |||
| Washington |
17 | 12 | 29 | |||
| Wisconsin |
— | 2 | 2 | |||
| Total United States |
113 | 82 | 195 | |||
| Canada |
— | 21 | 21 | |||
| Total |
113 | 103 | 216 | |||
Menu
Our menu is centered around our signature product, the gourmet burger, which we define as “anything that can go in, on or between two buns.” We make our gourmet burgers from beef, chicken, veggie, fish, turkey and pot roast, and serve them in a variety of recipes. We offer a wide selection of toppings for our gourmet burgers, including fresh guacamole, roasted green chilies, honey mustard dressing, grilled pineapple, crispy onion straws, sautéed mushrooms and a choice of six different cheeses. For example, one of our signature creations, the Banzai Burger, is marinated in teriyaki and topped with grilled pineapple, cheddar cheese, lettuce, tomato and mayonnaise.
In addition to gourmet burgers, which accounted for approximately 44.2% of our total food sales in 2002, we serve an array of other food items that are designed to appeal to a broad group of guests, including a variety of salads, soups, appetizers, other entrees such as rice bowls and pasta and desserts. One of our top selling non-burger items is the Baja Turkey Club, which features turkey, pepper-jack and cheddar cheeses, bacon, roasted green chilies, tomato and roasted pepper mayonnaise on grilled Texas toast. We serve all of our burgers and
45
sandwiches with “bottomless” French fries. Our guests can also choose from a wide variety of beverages, including Pepsi® products, smoothies, monster milkshakes, our proprietary Strawberry Ecstasy and our signature Mad Mixology® alcoholic and non-alcoholic specialty beverages like our Freckled Lemonade.
All of our menu items are prepared to order in our restaurants. The food items on our menu range in price from $2.99 to $12.49, with a per person average check of approximately $10.00, including beverages. Sales of alcoholic and non-alcoholic beverages represented approximately 9.0% and 13.3%, respectively, of total restaurant sales in 2002.
We continuously experiment with food and beverage items and flavor combinations to create selections that are imaginative and exciting to our guests. Ideas for new menu items are generated at the restaurant level as well as through consumer research and franchisees. Menu items are rotated on and off the menu based on the changing tastes of our guests. Every new recipe idea goes through our test menu development process. The proposed menu item must appeal to a sufficient number of guests and require a preparation time of less than eight minutes to be added to our menu. In addition, the corresponding ingredients must retain or improve the overall menu quality while meeting our gross profit margin targets. All new menu items are then test marketed for eight to 12 weeks in selected restaurants. Our franchisees are given the opportunity to review proposed menu items and offer feedback before the recipes are finalized and added to the menu.
Guest loyalty and experience
Through our unique guest service philosophy, which we describe as “unbridled,” we feel we have created a culture that has enabled us to build a strong and loyal guest base. Unbridled acts are common in our company, as our team members have a history of going far beyond the customary level of guest service. In 2002, we were proud to be recognized as a gold winner of Restaurants & Institutions 2002 Choice in Chains Award for excellence in customer service, food quality and overall dining experience, as voted on by a nationally representative sample of consumers.
We use many industry standard techniques to measure our guests’ experiences at our restaurants. These include comment cards, mystery shoppers, Internet feedback, market area and in-restaurant consumer research. We also employ several additional techniques at the restaurant level, including a “systems check” performed each week by our general managers to track and measure our guests’ experiences. This “systems check” evaluates our speed of service, our food preparation times and our seating utilization for each week. The key measurement criteria evaluated in our “systems check” contribute to our ability to give our guests the “gift of time.” We strive to provide guests with a 37-minute dining experience at lunch and 42 minutes at dinner. Our regional operations directors utilize these and other reports to determine which restaurants in their region may need additional support to address any problems.
Marketing and advertising
Our marketing strategy focuses on: 1) driving comparable restaurant sales by attracting new guests and increasing the frequency of visits by current guests; 2) supporting new restaurant openings to achieve their sales and profit goals; and 3) communicating a unique, powerful, and consistent brand. We accomplish these objectives through four major initiatives.
In-restaurant marketing
A significant portion of our marketing funds are spent in communicating with our guests while they are in our restaurants. The core of our strategy revolves around keeping our menu fresh, with innovative burgers and non-burger options. Three times per year we promote at least one new burger and one new non-burger item. These items are featured along with one of our gourmet beef burgers on table tents and other printed materials. This strategy focuses on highlighting both our core menu burgers along with new burgers and new non-burger
46
food items and beverages. The goal is to create variety and excitement for our guests, which we believe drives frequency of visits.
Local restaurant marketing
We believe we are a wholesome, values-focused leader in family casual dining. With our focus on women, teens and tweens, we have a unique opportunity to market our restaurant at the local level. We reach out to schools, churches, charities, and community organizations to build brand awareness within the communities that we serve.
We believe that teens and tweens are influential in family dining decisions. Data from an independent source indicates that in 2001 approximately 28.0% of our guests were under 18, which compared to 20.0% in the major casual dining bar and grill chains. We believe our local restaurant marketing invites trial by teens and tweens and provides us with a competitive advantage over other casual dining bar and grill chains.
Advertising
Although our restaurant concept is not media driven, we do spend a limited amount of our marketing dollars in select markets on various media advertising, including radio, print (mostly free-standing newspaper inserts) and outdoor (mostly billboards and other signage) to build brand awareness. Our media advertisements emphasize our gourmet burger passion and showcase key gourmet burgers. We also build and reinforce our brand in all internal and external visual advertising by highlighting the distinctive features of our red, black and yellow logo.
New restaurant openings
We use new restaurant openings as opportunities to reach out to the local media. Our openings are often featured on live local radio broadcasts and receive coverage in local newspapers. We employ a variety of marketing techniques in connection with our new restaurant openings, including community “VIP” parties, with invitations to media personalities and community leaders. We also typically tie our openings to a charitable event.
During 2002, we spent an aggregate of 4.1% of restaurant sales on marketing efforts. Of this amount, we spent 1.0% of restaurant sales on major media initiatives such as television commercials, radio advertisements and freestanding inserts in newspapers and other print media. We expect to continue investing a similar percentage of restaurant sales in marketing efforts in the future, primarily in connection with driving comparable restaurant sales and new restaurant openings.
Operations
Restaurant management
Our restaurant operations are divided into four distinct geographic regions, which are overseen by a senior regional operations director who reports to the vice president of operations. In general, each geographic region contains three to four regional operations directors, one to two regional recruiters, a regional training manager and one to two regional kitchen managers. Our regional directors oversee five to eight company-owned restaurants each, which we believe enables them to better support the general managers and achieve sales and cash flow targets for each restaurant within their region. In addition, the regional operations directors invest a portion of their time on franchised operations in their respective regions.
Our typical restaurant management team consists of a general manager, an assistant general manager, a kitchen manager and one or two assistant managers. Most of our restaurants employ approximately 85 hourly team members, many of whom work part-time. The general manager of each restaurant is responsible for the day-to-day operation of that restaurant, including hiring, training and development of team members, as well as operating results. The kitchen manager is responsible for product quality, daily production, shift execution, food costs and kitchen labor costs. Our restaurants are generally open Sunday through Thursday from 11:00 AM until 10:00 PM and on Friday and Saturday from 11:00 AM to 11:00 PM.
47
Operational tools and programs
We utilize a customized food and beverage analysis program that determines the optimal food and beverage costs for each restaurant and provides additional tools and reports to help us identify opportunities, such as waste management, which we believe affords us lower than industry average food and beverage costs. We also utilize a labor program to determine the optimal staffing needs of each restaurant based on its actual guest flow and demand.
We employ several additional operational tools, for example, each week, every general manager performs a “systems check” which tracks and measures our guests’ experiences based upon key criteria. This “systems check” evaluates our speed of service, our food preparation times and our seating utilization for each week. Our regional operations directors utilize these and other reports to determine which restaurants in their region may need additional support to address any problems.
Training
We strive to maintain quality and consistency in each of our restaurants through the careful training and supervision of team members and the establishment of, and adherence to, high standards relating to personnel performance, food and beverage preparation and maintenance of our restaurants. Each location has eight to ten certified trainers who provide classroom and on-the-job instruction for new team members. All of our trainers participate in an eight hour training seminar on good training skills, which provides them with knowledge and tactics to enable them to be better trainers and coaches. We provide all new team members with complete orientation and one-on-one training for their positions to ensure they are able to meet our high standards. All of our new team members are trained by partnering with a certified designated trainer to assure that the training and information they receive is complete and accurate. Team members are certified for their positions by passing a series of tests.
New restaurant managers are required to complete an eight-week training program that includes service, kitchen and management responsibilities. Newly trained managers are then assigned to their home restaurant where they spend one additional training week with their general manager. We place a high priority on our continuing management development programs in order to ensure that qualified managers are available for our future openings. We conduct semi-annual performance reviews with each manager to discuss prior performance and future performance goals. Once a year we hold a general manager conference in which our general managers receive additional training on financial management, food preparation, hospitality and other relevant topics.
When we open a new restaurant, we provide varying levels of training to team members in each position to ensure the smooth and efficient operation of the restaurant from the first day it opens to the public. Prior to opening a new restaurant, our dedicated training and opening team travels to the location to prepare for an intensive seven-day training program for all team members hired for the new restaurant opening. Part of the training teams stay on site during the first week of operation and an additional team of training support arrives for on-site support during the second and third weeks. We believe this additional investment in our new restaurants is important, because it helps us provide our guests with a quality dining experience from day one. We also make on-site training teams available when our franchisees open new restaurants. After a restaurant has been opened and is operating smoothly, the general manager supervises the training of new team members.
Recruiting and retention
We seek to hire experienced general managers and team members. We support our team members by offering competitive wages and benefits, including a 401(k) plan, an employee stock purchase plan, medical insurance and stock options for general managers. We motivate and prepare our team members by providing them with opportunities for increased responsibilities and advancement, as well as significant performance-based incentives tied to sales, profitability, certain qualitative measures and length of service at one of our restaurant
48
locations. For example, we provide our general managers with the use of a Jeep Wrangler for two years if they increase restaurant sales in a single restaurant by 15.0% for four consecutive quarters. If this increase is maintained for eight consecutive quarters, we give the manager outright title to the Jeep Wrangler. We also provide various other incentives, including vacations, car allowances and quarterly sales and profit bonuses. Our most successful general managers are eligible for promotion to training general manager status and are entitled to receive more lucrative compensation packages based on various performance criteria. We also provide monetary rewards for general managers who develop future managers for our restaurants.
Restaurant franchise and licensing arrangements
We intend to grow the number of new company-owned restaurants in a measured and disciplined manner. As a result, many areas of the United States are available for potential development by franchisees. We currently have 20 franchisees that operate 103 restaurants in 18 states and two Canadian provinces. We have 15 exclusive franchise development arrangements with our 20 franchisees. Our two largest franchisees are Red Robin Restaurants of Canada, Ltd., with 21 restaurants throughout Alberta and British Columbia, Canada, and Top Robin Ventures, Inc., with 15 restaurants in Southern California. As of the date of this filing, our franchisees have opened nine new restaurants and we expect our franchisees to open one additional restaurant during the remainder of 2003. The success of our current franchisees and the popularity of our concept have created significant interest by potential franchisees.
Each franchise arrangement typically consists of an area development agreement and a separate franchise agreement for each restaurant. Our current form of area development agreement grants exclusive rights to a franchisee to develop a minimum number of restaurants in a defined area, typically over a five-year period. Individual franchise agreements relate to the operation of each restaurant opened and typically have a term of 20 years with a renewal option for an additional ten years if certain conditions are satisfied.
Under our current form of area development agreement, we collect a $10,000 development fee for each restaurant the franchisee agrees to develop at the time we enter into the area development agreement. When a franchisee opens a new restaurant, we collect an additional $25,000 fee and we recognize a $35,000 franchise fee as income. We may charge lower development fees and franchise fees for existing franchisees. Our current form of franchise agreement requires the franchisee to pay a royalty fee equal to 4.0% of adjusted restaurant sales.
Franchisees are required to spend a minimum of 1.5% of adjusted restaurant sales on local advertising or promotional activities and to pay an advertising fee of 0.5% of adjusted restaurant sales to a cooperative advertising fund for marketing studies and the development of commercials or other print and electronic media promotional material. We also have the ability under most of our franchise agreements to require the franchisee to contribute up to 4.0% of adjusted sales to a separate national advertising and marketing fund. The royalty fee and advertising and marketing contributions of our franchisees vary depending on when the agreements were executed and the number of restaurants that the franchisee committed to open during the term of the area development agreement.
Franchise compliance assurance
We have instituted a comprehensive system to ensure the selection of quality franchisees and compliance with our systems and standards, both during the development and operating of franchise restaurants.
| • | Selection process. We generally select franchisees that are experienced, well capitalized, multi-unit restaurant operators or who have demonstrated the ability to raise capital and rapidly grow a multi-unit retail or service organization. During the selection process, we conduct comprehensive background, financial, and reference checks on all candidates. Key department heads will typically meet with each franchisee candidate and often visit their current business operations to assess his or her level of relevant expertise. References are obtained from the candidates as well as through industry sources, such as former suppliers, executives, managers, or other business associates. We will generally not grant development rights for the development of a single restaurant. |
49
| • | Development and operations. After a franchise agreement is signed, we actively work with and monitor our franchisees to ensure successful franchise operations as well as compliance with Red Robin systems and procedures. During the development phase, we assist in the selection of restaurant sites and the development of prototype and building plans, including all required changes by local municipalities and developers. After construction is completed, we review the building for compliance with our standards and provide eight trainers to assist in the opening of the restaurant. We advise the franchisee on menu, management training, and equipment and food purchases. At least once a year, we review all menu items and descriptions to ensure compliance with our requirements and standards. We require all suppliers of ground beef, if different than ours, to pay for and pass an annual inspection performed by third party auditors. Finally, on an ongoing basis, we conduct brand equity reviews on all franchise restaurants to determine their level of effectiveness in executing our concept at a variety of operational levels. Reviews are conducted by seasoned operations teams, last approximately two to three days, and focus on seven key areas including health, safety, brand foundation, and execution proficiency. |
To continuously improve our operations, we maintain a franchise marketing advisory council, a franchise business advisory council and a food and beverage committee. The councils provide advice to us regarding operations and consist of three franchisee representatives and three members of our senior management. The food and beverage committee is also comprised of three franchisee representatives and three members of our senior management team. In addition, several times each year we solicit feedback and insights on specific topics from the broad group of franchisees and then get together with them to discuss and share their insights. These gatherings, which we call “headwater meetings,” are an effort to attain a high level of franchisee buy-in and to assure the system is evolving in a positive direction through the exchange of best practices.
Management information systems
All of our restaurants use computerized management information systems, which are designed to improve operating efficiencies, provide corporate management with timely access to financial and marketing data, and reduce restaurant and corporate administrative time and expense. We believe our management information systems are sophisticated and are sufficient to support our restaurant expansion plans.
With the data provided by our information systems, we can report daily, weekly and period-to-date numbers on an automated daily report that is delivered via e-mail to our restaurants and our field personnel. On a weekly and a periodic basis, we issue other electronic reports that provide comparative data regarding food, labor and other cost information. Our information systems also enable us to automatically post restaurant level data, such as restaurant sales, cash and credit card receipts and promotion usage into our corporate accounting software. We also use our information systems to capture information regarding our payroll and the status of new and existing team members. Specifically, we use Menulink, a Windows-based product, to perform our restaurant-level bookkeeping, electronic ordering and food cost and management functions. Our Aloha Technologies point-of-sale system facilitates the supply of data to Menulink and also assists with labor scheduling and credit card authorizations. We have developed several in-house products to assist with our information systems. Our Scheduling Team Members and Reporting System, or STaRs, helps our managers schedule the optimal amount of team members at any time. We believe these systems enable both restaurant-level and corporate-level management to adequately supervise the operational and financial performance of our restaurants as necessary to support our planned expansion.
Food preparation, quality control and purchasing
We believe that we have some of the highest food quality standards in the industry. Our systems are designed to protect our food supply throughout the preparation process. We provide detailed specifications to suppliers for our food ingredients, products and supplies. We inspect specific qualified manufacturers and growers. Our purchasing team and restaurant managers are certified in a comprehensive safety and sanitations course by the National Restaurant Association. Minimum cook temperature requirements and twice-a-day line checks ensure the safety and quality of both burgers and other items we use in our restaurants.
50
We rely on SYSCO Corporation, a national food distributor, as the primary distributor of our food ingredients, supplies and other products. To maximize our purchasing efficiencies and obtain the lowest possible prices for our ingredients, products and supplies, while maintaining the highest quality, our centralized purchasing team generally negotiates all prices in one of two formats: 1) fixed price contracts with terms of between one month and one year or 2) monthly commodity pricing formulas. In order to provide the freshest ingredients and products, and to maximize operating efficiencies between purchase and usage, each restaurant’s kitchen manager determines the restaurant’s daily usage requirements for food ingredients, products and supplies. The kitchen manager orders accordingly from approved local suppliers and our national master distributor and all deliveries are inspected to ensure that the items received meet our quality specifications and negotiated prices. We believe that competitively priced, high quality alternative manufacturers, suppliers, growers and distributors are available should the need arise.
Team members
As of October 2003, we had approximately 11,250 employees, whom we refer to as team members, consisting of approximately 11,116 team members at company-owned restaurants and 134 team members at our corporate headquarters and in our regional offices. During our higher volume summer months, we experience an increase in the number of hourly team members in our restaurants of approximately 10.0%. None of our team members is covered by any collective bargaining agreement. We consider our team member relations to be good.
Competition
The restaurant industry is highly competitive. We compete on the basis of the taste, quality, price of food offered, guest service, ambiance, location and overall dining experience. We believe that our guest demographics, our gourmet burger concept, attractive price-value relationship, and the quality of our food and service enable us to differentiate ourselves from our competitors. Although we believe we compete favorably with respect to each of these factors, many of our direct and indirect competitors are well-established national, regional or local chains, and some have substantially greater financial, marketing, and other resources than we do. We also compete with many other restaurant and retail establishments for site locations and restaurant-level team members.
Properties
We lease the majority of our restaurant facilities, although we own real estate for our restaurants in:
| • | Mesa, Peoria and Prescott, Arizona; |
| • | Moreno Valley and Yuba City, California; |
| • | Castle Rock and Highlands Ranch, Colorado; |
| • | Columbia, Maryland; |
| • | St. Peters, Missouri; |
| • | North Olmstead and West Chester, Ohio; |
| • | Oxford Valley, Pennsylvania; |
| • | Fairlakes, Glen Allen (Richmond) and Potomac Mills, Virginia; |
| • | Issaquah, Washington; and |
| • | Lake Howell, Florida and Grapevine, Texas, restaurant properties leased to others. |
The majority of our leases are for 20-year terms and include options to extend the terms. The majority of our leases also include both minimum rent and percentage-of-sales rent provisions. See “Restaurant Locations” for additional details regarding our restaurant facilities.
51
We lease approximately 1,500 square feet of regional office in Seattle, Washington, under an agreement expiring in October 2005. In addition, we lease approximately 2,900 square feet of regional office space in Tustin, California, under an agreement expiring in December 2007. The Tustin lease includes an option to extend for five years.
Our corporate headquarters are located in Greenwood Village, Colorado. We occupy this facility under a lease that expires in January 2004. On October 27, 2003, we entered into a letter of intent for a new headquarters office near our existing corporate headquarters, for a multi-year term commencing in the first quarter of 2004. We do not expect to suffer any business interruption resulting from our relocation.
Trademarks
Our registered trademarks and service marks include, among others, the marks “Red Robin®,” “America’s Gourmet Burgers & Spirits®” and “Mad Mixology®” and our logo. We have registered these marks with the United States Patent and Trademark Office. We have registered or have registrations pending in Canada for our most significant trademarks and service marks. In order to better protect our brand, we have also registered the Internet domain name “www.redrobin.com.” We believe that our trademarks, service marks, and other proprietary rights have significant value and are important to our brand-building efforts and the marketing of our restaurant concepts. We have in the past and expect to continue to vigorously protect our proprietary rights. We cannot predict, however, whether steps taken by us to protect our proprietary rights will be adequate to prevent misappropriation of these rights or the use by others of restaurant features based upon, or otherwise similar to, our concept. It may be difficult for us to prevent others from copying elements of our concept and any litigation to enforce our rights will likely be costly and may not be successful. Although we believe that we have sufficient rights to all of our trademarks and service marks, we may face claims of infringement that could interfere with our ability to market our restaurants and promote our brand. Any such litigation may be costly and divert resources from our business. Moreover, if we are unable to successfully defend against such claim(s), we may be prevented from using our trademarks and/or service marks in the future and may be liable for damages.
Government regulation
Our restaurants are subject to licensing and regulation by state and local health, safety, fire and other authorities, including licensing and regulation requirements for the sale of alcoholic beverages and food. To date, we have not experienced an inability to obtain or maintain any necessary licenses, permits or approvals, including restaurant, alcoholic beverage and retail licensing. The development and construction of additional restaurants will also be subject to compliance with applicable zoning, land use, and environmental regulations. We are also subject to federal regulation and state laws that regulate the offer and sale of franchises and substantive aspects of a franchisor-franchisee relationship. Various federal and state labor laws govern our relationship with our team members and affect operating costs. These laws include minimum wage requirements, overtime, unemployment tax rates, workers’ compensation rates, citizenship requirements and sales taxes. In addition, the Federal Americans with Disabilities Act prohibits discrimination on the basis of disability in public accommodations and employment.
Litigation
Occasionally, we are a defendant in litigation arising in the ordinary course of our business, including claims resulting from “slip and fall” accidents, employment related claims and claims from guests or team members alleging illness, injury or other food quality, health or operational concerns. To date, none of these types of litigation, all of which are generally covered by insurance policies, has had a material effect on us, and as of the date of this filing, we are not a party to any litigation that we believe would have a material adverse effect on our business.
52
The following table sets forth information about our executive officers, other key officers and directors as of November 3, 2003:
| Name |
Age |
Position | ||
| Executive Officers: |
||||
| Michael J. Snyder |
53 | Chairman of the Board, Chief Executive Officer, President | ||
| James P. McCloskey |
52 | Chief Financial Officer | ||
| Michael E. Woods |
53 | Senior Vice President of Franchise Development | ||
| Robert J. Merullo |
49 | Senior Vice President of Restaurant Operations | ||
| Todd A. Brighton |
45 | Vice President of Development | ||
| Eric C. Houseman |
35 | Vice President of Restaurant Operations | ||
| Other Key Officers: |
||||
| G. Dwayne Chambers |
38 | Vice President of Marketing | ||
| John W. Grant |
56 | Vice President and General Counsel | ||
| Jeffrey T. Neely |
42 | Vice President of Franchise Operations | ||
| Charles K. Dusenberry II |
49 | Vice President of Design and Construction | ||
| Robert F. Fix |
50 | Vice President of Franchise Sales | ||
| Douglas D. Gammon |
56 | Vice President of Human Resources | ||
| Lisa A. Dahl |
45 | Vice President and Controller | ||
| Howard C. Jenkins |
60 | Vice President of Management Information Systems | ||
| Ray S. Masters |
44 | Vice President of Purchasing | ||
| Scott A. Schooler |
35 | Vice President of Food and Beverage | ||
| Directors: |
||||
| Terrence D. Daniels |
60 | Director | ||
| Benjamin D. Graebel |
48 | Director | ||
| Edward T. Harvey |
55 | Director | ||
| Dennis B. Mullen |
60 | Director | ||
| Gary J. Singer |
51 | Director | ||
Michael J. Snyder. Mr. Snyder was elected as our president, chief operating officer and as a director in April 1996. In March 1997, Mr. Snyder was elected as our chief executive officer. In May 1997, Mr. Snyder was elected as our chairman of the board. From 1979 to May 2000, Mr. Snyder also served as president of The Snyder Group Company.
James P. McCloskey. Mr. McCloskey was elected as our chief financial officer and secretary in June 1996. From March 1994 to January 1996, Mr. McCloskey served as chief financial officer for Avalon Software in Tucson, Arizona. From July 1988 to March 1994, Mr. McCloskey served as chief financial officer for Famous Amos Cookies in San Francisco, California.
Michael E. Woods. Mr. Woods joined us in January 1997 as our vice president of franchise development and was appointed senior vice president in January 1999. From 1992 to June 1999, Mr. Woods also served as director of corporate development for The Snyder Group Company.
Robert J. Merullo. Mr. Merullo joined us in April 2000 as our senior vice president of restaurant operations. Mr. Merullo was the director of operations for The Snyder Group Company from November 1991 to April 2000.
53
Todd A. Brighton. Mr. Brighton joined us in April 2001 as our vice president of development with management responsibility over real estate and design and construction. From August 1999 to April 2001, Mr. Brighton was director of real estate with RTM Restaurant Group and was responsible for strategic analysis and market planning for three restaurant chains. From November 1996 to July 1999, Mr. Brighton was the western development manager for Blockbuster Entertainment, Inc. and was responsible for all real estate development in 17 states and select international markets.
Eric C. Houseman. Mr. Houseman joined us in 1993 and has served as our vice president of restaurant operations since March 2000. From 1993 to March 2000, he served in various regional operations management positions with our company.
G. Dwayne Chambers. Mr. Chambers joined us in August 2003 as our vice president of marketing with responsibility for marketing, advertising, media buying and public relations. From July 1999 to May 2003, Mr. Chambers served as vice president of marketing for Sonic Drive Ins. From May 1987 to June 1999, Mr. Chambers served in various positions including vice president at Moroch and Associates in Dallas where he directed the agency’s McDonald’s account.
John W. Grant. Mr. Grant joined us in January 1995 as our director of real estate and legal and was promoted to vice president and general counsel in August 1996. From December 1993 to December 1994, Mr. Grant was self-employed as an attorney in Santa Barbara, California.
Jeffrey T. Neely. Mr. Neely joined us in November 2003 as our vice president of franchise operations. From February 2000 to October 2003, Mr. Neely served as senior director of franchise and license operations at Einstein & Noah Bagel Corporation. From September 1989 to January 2000, Mr. Neely served as president and chief executive officer of Domino’s Pizza Neely Enterprises of Wichita.
Charles K. Dusenberry II. Mr. Dusenberry joined us in March 2002 as our vice president of design and construction. From 1996 to March 2002, Mr. Dusenberry was the vice president of construction, design and facilities for Pizzeria Uno.
Robert F. Fix. Mr. Fix joined us in March 2001 as our vice president of franchise sales. From 1996 until March 2001, Mr. Fix was director of U.S. franchise development for Boston Pizza International of Richmond in British Columbia, Canada.
Douglas D. Gammon. Mr. Gammon joined us in November 2003 as our vice president of human resources. From March 1997 to October 2003, Mr. Gammon served as senior vice president of human resources and people development at Taco Cabana, Inc. From December 1989 to March 1997, Mr. Gammon served as vice president of human resources at Marriott International. Mr. Gammon has served as past president for the Council of Hotel and Restaurant Trainers.
Lisa A. Dahl. Ms. Dahl joined us in March 1997 as our corporate controller and was promoted to vice president in January 2003. Prior to joining us, Ms. Dahl was an accounting director for Vicorp Restaurants. Ms. Dahl is a certified public accountant and has served as chairperson for the National Restaurant Association Finance Executive Group.
Howard C. Jenkins. Mr. Jenkins joined us in December 1996 as our vice president of management information systems. Prior to 1996, Mr. Jenkins held various senior management positions in information technology, material management, and manufacturing for defense and commercial corporations. He has also performed various consulting services involving the implementation of enterprise resource planning systems. Mr. Jenkins is a member of the Food Service Technology Exposition Board, a member of the Hospitality Technology Visionary Board and has served as the chairman for the National Restaurant Association MIS Executive Study Group.
54
Ray S. Masters. Mr. Masters joined us in May 1996 as director of purchasing and was promoted to vice president of purchasing in October 1998. Prior to joining us, Mr. Masters held multi-unit national account executive sales positions with SYSCO Foods and Johnsonville Foods.
Scott A. Schooler. Mr. Schooler joined us in April 2000 as vice president of food and beverage. He was the director of food and beverage for The Snyder Group Company from March 1987 to April 2000.
Terrence D. Daniels. Mr. Daniels joined us as a director in May 2000. Mr. Daniels has been a partner with Quad-C in Charlottesville, Virginia since its formation in November 1989. Prior to November 1989, Mr. Daniels served as vice chairman and director of W.R. Grace & Co., as chairman, president and chief executive officer of Western Publishing Company, Inc. and as senior vice president for corporate development of Mattel, Inc. In October 2001, Nationwide Warehouse & Storage, LLC, et al., a portfolio company of Quad-C, filed a petition in bankruptcy. For the two years prior to the filing, Mr. Daniels served as a director and officer of Nationwide, but did not have any day-to-day management duties.
Benjamin D. Graebel. Mr. Graebel joined us as a director in September 2002. Since July 2000, Mr. Graebel has served as the chief executive officer for the Graebel Companies, Inc. of Denver, Colorado, a privately held transportation and relocation service provider. Since joining the Graebel Companies in June 1979, and prior to his appointment as the chief executive officer of the Graebel Companies, Mr. Graebel held a variety of management positions, including regional vice president, president of the moving and storage group and chief operating officer.
Edward T. Harvey. Mr. Harvey joined us as a director in May 2000. Mr. Harvey has been a partner with Quad-C in Charlottesville, Virginia since April 1990. From 1975 to April 1990, Mr. Harvey held various financial positions at W.R. Grace & Co., principally in corporate development, acquisitions and planning. In October 2001, Nationwide Warehouse & Storage, LLC, et al., a portfolio company of Quad-C, filed a petition in bankruptcy. For the two years prior to the filing, Mr. Harvey served as a director and officer of Nationwide, but did not have any day-to-day management duties.
Dennis B. Mullen. Mr. Mullen joined us as a director in December 2002. Mr. Mullen has been a private investor for the past five years. Mr. Mullen currently serves as a lead trustee for Janus Funds, chairs the Janus Funds’ nominating and governance committee, and serves on the Janus Funds’ audit and brokerage committees. As a trustee for Janus Funds, Mr. Mullen has also chaired the audit committee. Prior to 1998, Mr. Mullen had more than 30 years experience as a corporate executive in the restaurant industry, and has served as chief executive officer for several restaurant chains.
Gary J. Singer. Mr. Singer joined us as a director in June 1993. Mr. Singer has been a partner at the law firm of O’Melveny & Myers LLP, an international law firm, since February 1985 and has been associated with O’Melveny & Myers since 1977.
55
Acquisition of The Snyder Group Company
In February 2000, our operating subsidiary, Red Robin International, Inc., entered into an agreement and plan of merger with The Snyder Group Company and the stockholders of The Snyder Group Company, whereby we agreed to acquire all of the outstanding capital stock of The Snyder Group Company in exchange for approximately 1.9 million shares of our common stock, $9.2 million in debentures and $1.8 million in cash and promissory notes payable to the stockholders of The Snyder Group Company. We completed this acquisition in May 2000.
In connection with this transaction, certain stockholders of The Snyder Group Company who are also one of our directors, officers or principal stockholders received the following:
| • | Mike Snyder, our chief executive officer, received $4,100 in cash, $5.1 million in debentures repaid by us in August 2001, $18,870 in debentures repaid by us in May 2001 and 793,647 shares of our common stock. |
| • | Mike Woods, our senior vice president of franchise development, received $2,241 in cash, $399,934 pursuant to a promissory note repaid by us in August 2001 and 69,340 shares of our common stock. |
| • | Bob Merullo, our senior vice president of operations, received $2,241 in cash, $399,934 pursuant to a promissory note repaid by us in August 2001 and 69,340 shares of our common stock. |
| • | Steve Snyder, Mike Snyder’s brother and the president of OTL, Ltd., one of our principal stockholders, and his wife each received $2,050 in cash, $2.1 million in debentures repaid by us in August 2001, $9,435 in debentures repaid by us in May 2001 and 396,824 shares of our common stock. |
In connection with our acquisition of The Snyder Group Company in May 2000, we entered into a non-interference, non-disclosure and non-competition agreement with Mr. Snyder. Pursuant to this agreement, Mr. Snyder has agreed that he will not engage in any activity relating to the casual dining business anywhere in the United States until May 2005. Mr. Snyder has also agreed that he will not disclose any confidential information relating to us or our business. Finally, Mr. Snyder has agreed that, until March 2005, he will not (i) solicit or induce any employee at the level of assistant restaurant manager or higher to terminate employment with us, (ii) hire any employee at the level of assistant restaurant manager or higher who was employed with us within the prior 12 months, or (iii) induce or attempt to induce any supplier or other business relationship of ours to cease doing business with us or otherwise interfere with our relationship with such suppliers or business relations.
Transactions with Quad-C
In May 2000, we sold an aggregate of 4,310,344 shares of our common stock to RR Investors, LLC and RR Investors II, LLC, two entities affiliated with Quad-C and its principals, for a purchase price of $25.0 million. Edward T. Harvey, one of our directors and a member of the audit and compensation committees of our board of directors, is the president and a director of RR Investors. In addition, Mr. Harvey holds a membership interest in Quad-C Advisors V, the general partner of RR Investor’s sole member, Quad-C Partners V, L.P. Terrence D. Daniels, one of our other directors and the chairman of the compensation committee of our board of directors, is the vice president and secretary of RR Investors. In addition, Mr. Daniels holds a membership interest in Quad-C Advisors V. Mr. Harvey is also the president and a director and Mr. Daniels is the vice president and secretary of RR Investors II, LLC. Mr. Harvey, Mr. Daniels and certain members of their immediate families own, directly or indirectly, membership interests of RR Investors II.
Concurrently with this sale of our common stock to RR Investors and RR Investors II, we entered into a consulting services agreement with Quad-C Management, Inc. In accordance with this agreement, we were required to pay Quad-C Management an aggregate of $200,000 per year, payable quarterly, for consulting services. Fees paid under this agreement were $78,000 in 2000 and $200,000 in 2001 and $113,000 in 2002. This agreement was terminated in connection with our initial public offering. Mr. Harvey and Mr. Daniels are principals of and maintain ownership interests in Quad-C Management.
56
Option exercises
In April 2002, our board of directors approved the early exercise of options to purchase up to 775,862 shares of our common stock held by certain of our executive officers under our 2000 management performance common stock option plan and the exercise of options to purchase an additional 146,552 shares of our common stock subject to currently exercisable options held by certain of our executive officers under our 1990 and 1996 stock option plans:
| • | Mike Snyder elected to exercise options to purchase an aggregate of 517,241 shares of common stock. Mr. Snyder paid the exercise price by delivering a full recourse promissory note in the principal amount of $3,000,000. This promissory note bears interest at 4.65% per annum, with principal and accrued and unpaid interest due and payable on December 31, 2009. Interest accrued under the note as of October 5, 2003 totaled approximately $205,482. |
| • | Jim McCloskey elected to exercise options to purchase an aggregate of 172,415 shares of common stock. Mr. McCloskey paid the exercise price by delivering three full recourse promissory notes in the aggregate principal amount of $1,050,000. These promissory notes bear interest at 4.65% per annum, with principal and accrued and unpaid interest due and payable as follows: June 26, 2006 with respect to $600,000 principal amount, December 31, 2009 with respect to $200,000 principal amount and January 29, 2012 with respect to $250,000 principal amount. During September 2003, Mr. McCloskey sold 20,500 shares of common stock and in accordance with the provisions of his secured promissory note repaid $40,139 representing all interest then outstanding on his note and $78,721 of principal on the note secured by the shares then sold. Interest accrued under the notes as of October 5, 2003 totaled approximately $31,652. |
| • | Bob Merullo elected to exercise options to purchase 86,207 shares of common stock. Mr. Merullo paid the exercise price by delivering a full recourse promissory note in the principal amount of $500,000. This promissory note bears interest at 4.65% per annum, with principal and accrued and unpaid interest due and payable on December 31, 2009. Interest accrued under the note as of October 5, 2003 totaled approximately $34,247. |
| • | Mike Woods elected to exercise options to purchase an aggregate of 146,551 shares of common stock. Mr. Woods paid the exercise price by delivering two full recourse promissory notes in the aggregate principal amount of $850,000. These promissory notes bear interest at 4.65% per annum, with principal and accrued and unpaid interest due and payable as follows: January 6, 2007 with respect to $250,000 principal amount and December 31, 2009 with respect to $600,000 principal amount. Interest accrued under the notes as of October 5, 2003 totaled approximately $58,220. |
The indebtedness represented by each executive officer’s promissory note or notes becomes immediately due and payable in the event that the executive officer’s employment is terminated for any reason. Each executive officer has pledged the shares acquired by him as collateral for repayment of his respective full recourse promissory note or notes. The shares acquired by each executive officer upon the early exercise of stock options are subject to a right of repurchase in our favor at the lower of the price paid by the executive officers for the shares acquired by them upon the early exercise of their stock options or the fair market value of these shares on the date that we exercise our right of repurchase. Our right to repurchase lapses on the same schedule that the shares underlying the original options would have become vested and exercisable as follows:
| • | 379,310 shares acquired by Mr. Snyder, 103,448 shares acquired by Mr. Woods, 34,483 shares acquired by Mr. McCloskey and 86,207 shares acquired by Mr. Merullo vested as of July 24, 2002 by resolution of our board of directors following the closing of our initial public offering. |
| • | 68,966 shares acquired by Mr. Snyder vested in May 2002 and the remaining 68,965 shares vested in May 2003. |
| • | 11,494 shares acquired by Mr. McCloskey will vest in January 2004, an additional 11,494 shares will vest in January 2005 and the remaining 11,495 shares will vest in January 2006. |
57
Board representation and registration rights
Pursuant to a registration rights agreement, certain Quad-C affiliated entities have the right to demand that we register their shares of common stock two times. In addition, if we propose to register any of our securities under the Securities Act, certain Quad-C affiliated entities and certain of our other stockholders are entitled to notice of the registration and to include their registrable shares in the offering. The underwriters have the right to limit the number of shares included in the registration to their discretion. We are required to bear substantially all costs incurred in these registrations, other than underwriting discounts and commissions; provided, however, that in connection with this offering, we have agreed to reimburse certain Quad-C affiliated entities and the other selling stockholders for a portion of the underwriting discounts and commissions to be paid by them in the amount of approximately $ per share, or $ in the aggregate.
Indemnification agreements
Our amended and restated bylaws provide that we shall indemnify our directors and officers to the fullest extent permitted by Delaware law, provided that, with respect to proceedings initiated by our officers and directors, we are only required to indemnify these persons if the proceeding was authorized by our board of directors. Our bylaws permit us, by action of our board of directors, to indemnify our other employees and agents to the same extent as we are required to indemnify our officers and directors. We are also empowered under our bylaws to enter into indemnification agreements with our directors, officers, employees or agents and to purchase insurance on behalf of any of our director, officer, employee or agent whether or not we are required or permitted to indemnify such persons under Delaware law.
We have entered into indemnification agreements with certain of our directors and executive officers and intend to enter into indemnification agreements with all of our other directors and executive officers in connection with the consummation of this offering. Under these agreements, we will indemnify our directors and executive officers against amounts actually and reasonably incurred in connection with actual or threatened proceedings if any of them may be made a party because of their role as one of our directors or officers. We are obligated to pay these amounts only if the officer or director acted in good faith and in a manner that he or she reasonably believed to be in or not opposed to our best interests. For any criminal proceedings, we are obligated to pay these amounts only if the officer or director had no reasonable cause to believe his or her conduct was unlawful. The indemnification agreements also set forth procedures that will apply in the event of a claim for indemnification thereunder.
In addition, our amended and restated bylaws provide that our directors will not be personally liable to us or our stockholders for monetary damages for any breach of fiduciary duty as a director, except for liability:
| • | for any breach of the director’s duty of loyalty to us or our stockholders; |
| • | for acts or omissions not in good faith or which involve intentional misconduct or a knowing violation of law; |
| • | under Section 174 of the Delaware General Corporation Law; or |
| • | for any transaction from which the director derives an improper personal benefit. |
There is no pending litigation or proceeding involving any of our directors or officers for which indemnification is being sought, nor are we aware of any pending or threatened litigation that may result in claims for indemnification by any director or officer.
Other related party transactions
Pursuant to our employment agreement with Mr. Snyder, we extended two loans to Mr. Snyder, each in the aggregate principal amount of $300,000. The first loan is evidenced by a promissory note dated June 30, 2000, which bears interest at 6.62%. The second loan is evidenced by a promissory note, dated February 27, 2001, which bears interest at 5.07%. These loans are secured by a pledge of 150,000 shares of common stock owned by
58
Mr. Snyder to us, and are payable in May 2005. During 2002, the board of directors determined that interest on the loans would not be waived and would be due and payable upon maturity of each note. The notes are recorded as a reduction of stockholders’ equity, and interest income of $81,622 and $31,559, earned during fiscal 2002 and the forty weeks ended October 5, 2003, has been recorded as an increase in the carrying value of the notes.
Mike Snyder and Bob Merullo have an ownership interest in one of our franchisees, Mach Robin, LLC. Mike Snyder owns 31.0% and Bob Merullo owns 7.0%. We recognized franchise and royalty fees from Mach Robin in the amounts of $415,649 in 2000 and $803,198 in 2001, $921,916 in 2002, and $703,392 in the forty weeks ended October 5, 2003. Mach Robin has a 40.0% ownership interest and a right to share in up to 60.0% of the profits of one of our other franchisees, Red Robin Restaurants of Canada, Ltd. We recognized franchise and royalty fees from Red Robin Restaurants of Canada in the amounts of $940,670 in 2000 and $849,801 in 2001, $785,618 in 2002, and $654,560 in the forty weeks ended October 5, 2003.
From July 2001 to June 2002, we leased our restaurant building located at 9130 South Crown Crest Boulevard, Parker, Colorado 80138, from 2J Crown Point, LLC, which was indirectly managed by one of Mr. Snyder’s brothers, Steve Snyder. Stol Operating, Ltd. is the manager of 2J Crown Point and Steve Snyder is the president and sole owner of Stol Operating. The lease was transferred by Stol Operating, Ltd. to a third party during June 2002. Total rent paid to 2J Crown Point, LLC was $62,732 in 2001 and $87,354 in 2002.
We lease our restaurant building located at 3272 Fuhrman Avenue East, Seattle, Washington 98102, from Gerald R. Kingen, who previously served on our board of directors until May 2000. The lease is for a term of nine years, ending in April 2009, and rent due under the lease is currently $11,068 per month.
Our indoor plant maintenance supplier, Tropical Interiors, is operated by one of Mr. Snyder’s brothers, Brad Snyder. We paid Tropical Interiors $152,279 in 2000, $132,711 in 2001, $199,740 in 2002 and $179,114 in the forty weeks ended October 5, 2003.
Gary J. Singer, a member of our board of directors and a member of the compensation committee of our board of directors, is a partner of O’Melveny & Myers LLP. We have engaged O’Melveny & Myers to represent us on various legal matters, including acquisitions, financings, this offering and general corporate matters.
Benjamin D. Graebel, a member of our board of directors since September 2002, is the chief executive officer of a privately held transportation and relocation service provider. We paid this firm $106,087 in 2000, 33,936 in 2001, $281,544 in 2002 and $61,409 in the forty weeks ended October 5, 2003.
On May 11, 2000, we sold an aggregate of 775,862 shares of our common stock to Hibari Guam Corporation, an affiliate of Skylark Co., Ltd., which holds in excess of 5.0% of our common stock, in exchange for the satisfaction, forgiveness and cancellation of a promissory note executed in favor of Hibari Guam in the principal amount of $4.5 million pursuant to a common stock subscription agreement.
59
PRINCIPAL AND SELLING STOCKHOLDERS
The following table shows information regarding the beneficial ownership of our common stock before and after the consummation of this offering for:
| • | each person who is known to us to beneficially own more than 5.0% of our common stock; |
| • | each of our directors; |
| • | each named executive officer; |
| • | all directors and executive officers as a group; and |
| • | each selling stockholder |
Unless otherwise indicated, the address for each person or entity named below is c/o Red Robin Gourmet Burgers, Inc., 5575 DTC Parkway, Suite 110, Greenwood Village, CO 80111.
Beneficial ownership is determined in accordance with the rules of the Securities and Exchange Commission and generally includes voting or investment power with respect to securities. Except as indicated by footnote, and except for community property laws where applicable, the persons named in the table below have sole voting and investment power with respect to all shares of common stock shown as beneficially owned by them. The percentage of beneficial ownership is based on 15,206,074 shares of common stock outstanding as of October 5, 2003 and 15,956,074 shares outstanding immediately after the offering.
| Shares Beneficially Owned Prior to the Offering(1) |
Shares Being Offered |
Shares Beneficially Owned After the Offering(1) |
||||||||||
| Name and Address |
Number |
Percent |
Number |
Percent |
||||||||
| Quad-C Partners V, L.P.(2) |
3,679,177 | 24.2 | % | 721,155 | 2,958,022 | 18.5 | % | |||||
| RR Investors, LLC(2) |
3,679,177 | 24.2 | % | 721,155 | 2,958,022 | 18.5 | % | |||||
| RR Investors II, LLC(2) |
147,167 | 1.0 | % | 28,845 | 118,322 | * | ||||||
| Skylark Co., Ltd.(3) |
1,958,673 | 12.9 | % | 1,958,673 | — | * | ||||||
| Hibari Guam Corporation(3) |
355,225 | 2.3 | % | 355,225 | — | * | ||||||
| Michael J. Snyder(4) |
1,483,302 | 9.8 | % | — | 1,483,302 | 9.3 | % | |||||
| James P. McCloskey(5) |
152,326 | 1.0 | % | — | 152,326 | 1.0 | % | |||||
| Michael E. Woods(6) |
215,892 | 1.4 | % | — | 215,892 | 1.4 | % | |||||
| Robert J. Merullo(7) |
155,547 | 1.0 | % | — | 155,547 | 1.0 | % | |||||
| Todd A. Brighton(8) |
25,862 | * | — | 25,862 | * | |||||||
| Eric C. Houseman(9) |
20,802 | * | — | 20,802 | * | |||||||
| Terrence D. Daniels(10) |
3,827,344 | 25.2 | % | 750,000 | 3,077,344 | 19.3 | % | |||||
| Benjamin D. Graebel(11) |
2,500 | * | — | 2,500 | * | |||||||
| Edward T. Harvey(12) |
3,827,344 | 25.2 | % | 750,000 | 3,077,344 | 19.3 | % | |||||
| Dennis B. Mullen |
4,000 | * | — | 4,000 | * | |||||||
| Gary J. Singer(13) |
6,518 | * | — | 6,518 | * | |||||||
| Directors and executive officers as a group (11 persons)(14) |
5,895,093 | 38.8 | % | 750,000 | 5,145,093 | 32.2 | % | |||||
| * | Represents beneficial ownership of less than one percent (1.0%) of the outstanding shares of our common stock. |
| (1) | This table is based, in part, upon information supplied by the selling stockholders. If a stockholder holds options or other securities that are exercisable or otherwise convertible into our common stock within 60 days of October 5, 2003, we treat the common stock underlying those securities as owned by that stockholder, and as outstanding shares when we calculate the stockholder’s percentage ownership of our common stock. However, we do not consider that common stock to be outstanding when we calculate the percentage ownership of any other stockholder. |
| (2) | 3,679,177 shares of our common stock are owned of record by RR Investors, LLC. As the sole member of RR Investors, Quad-C Partners V, L.P. has the sole power to vote and dispose of the shares held by RR Investors. Quad-C Advisors V, L.L.C. is the general partner of Quad-C Partners V and, as such, may be deemed to beneficially own the 3,679,177 shares owned by RR Investors. The amount of shares beneficially owned by Quad-C Partners does not include the 147,167 shares of common stock held of record by RR Investors II, LLC. On August 20, 2003, RR Investors and RR Investors II sold 465,385 and 18,615 shares of common stock, respectively, at a price of $21.15. If the over-allotment option is exercised in full, RR Investors and RR Investors II will hold 2,459,174 and 98,369 shares of common stock, respectively, after this offering. See footnotes 10 and 12, below, for more information regarding RR Investors and RR Investors II. The address of these stockholders is c/o Quad-C Management, Inc., 230 East High Street, Charlottesville, Virginia 22902. |
60
| (3) | The amount of shares beneficially owned by Skylark Co., Ltd. includes 355,225 shares of common stock held by Hibari Guam Corporation, an indirect wholly owned subsidiary of Skylark. The address of these stockholders is Shacho-Shitsu Branch, 16th Floor, Shinjuku Green Tower, 6-14-1 Nishi Shinjuku, Shinjuku, Tokyo 160-0023 Japan. Hibari Guam’s address is 9999 South Marine Drive, Temuning, Guam 96911. |
| (4) | Includes 34,483 shares held by Amalfi Kapital, LLC, a wholly owned subsidiary of Bunch Grass Leasing, LLC. Mr. Snyder is a 50.0% owner of Bunch Grass Leasing. Mr. Snyder disclaims beneficial ownership of these shares. |
| (5) | Includes 3,034 shares held by the Claire C. McCloskey Trust, 2,534 shares held by the Megan L. McCloskey Trust and 3,034 shares held by the James P. McCloskey, Jr. Trust, the sole beneficiaries of which are Mr. McCloskey’s children. This amount also includes 9,760 shares held by the James P. McCloskey Retained Annuity Trust. On September 15, 2003, the Megan L. McCloskey Trust sold 500 shares of common stock at a price of $25.00 per share, and on September 15 and 16, 2003, Mr. McCloskey sold 20,000 shares of common stock at prices ranging from $24.91 to $25.05. |
| (6) | Includes an aggregate of 3,448 shares held by Mr. Woods’ minor children. |
| (7) | Includes an aggregate of 5,172 shares held by Mr. Merullo’s minor children. |
| (8) | Consists of 25,862 shares of common stock subject to options exercisable within 60 days of October 5, 2003. |
| (9) | Includes 16,354 shares of common stock subject to options exercisable within 60 days of October 5, 2003. On September 4, 2003, Mr. Houseman exercised stock options and acquired 1,750 shares of common stock at an exercise price of $5.80 and sold those shares of common stock at a price of $24.30. On September 5, 2003, Mr. Houseman exercised stock options and acquired 3,448 shares of common stock at an exercise price of $5.80. |
| (10) | Consists of 3,679,177 shares of common stock held by RR Investors, LLC; 147,167 shares of common stock held by RR Investors II, LLC; and 1,000 shares of common stock subject to options granted to Mr. Daniels which are exercisable within 60 days of October 5, 2003. On August 20, 2003, RR Investors and RR Investors II sold 465,385 and 18,615 shares of common stock, respectively, at a price of $21.15. Mr. Daniels is the vice president and secretary of each of RR Investors and RR Investors II and, as such, shares voting and dispositive power as to the shares held by RR Investors and RR Investors II. In addition, Mr. Daniels has an indirect membership interest in RR Investors as a holder of a 40.0% membership interest in Quad-C Advisors V, L.L.C., the general partner of the sole member of RR Investors, Quad-C Partners V, L.P. Mr. Daniels also has a membership interest in RR Investors II equal to 22.5% and his four children collectively own an additional 20.8% of the outstanding membership interests of RR Investors II. Of the 750,000 shares of common stock being offered, 721,155 shares are held by RR Investors and 28,845 shares are held by RR Investors II. If the over-allotment option is exercised in full, RR Investors and RR Investors II will hold 2,459,174 and 98,369 shares of common stock, respectively, after this offering. Mr. Daniels disclaims beneficial ownership of these shares except to the extent of Mr. Daniels’ pecuniary interest therein. |
| (11) | Includes 2,500 shares of common stock subject to options exercisable within 60 days of October 5, 2003. |
| (12) | Consists of 3,679,177 shares of common stock held by RR Investors, LLC; 147,167 shares of common stock held by RR Investors II, LLC; and 1,000 shares of common stock subject to options granted to Mr. Harvey which are exercisable within 60 days of October 5, 2003. On August 20, 2003, RR Investors and RR Investors II sold 465,385 and 18,615 shares of common stock, respectively, at a price of $21.15. Mr. Harvey is the president and a director of each of RR Investors and RR Investors II and, as such, shares voting and dispositive power as to the shares held by RR Investors and RR Investors II. In addition, Mr. Harvey has an indirect membership interest in RR Investors as a holder of a 15.0% membership interest in Quad-C Advisors V, L.L.C., the general partner of the sole member of RR Investors, Quad-C Partners V, L.P. Mr. Harvey also has an indirect membership interest in RR Investors II through High Street Holdings, L.C., in which he is the manager and has an 80.0% ownership interest. High Street Holdings has a 16.3% membership interest in RR Investors II. Of the 750,000 shares of common stock being offered, 721,155 shares are held by RR Investors and 28,845 shares are held by RR Investors II. If the over-allotment option is exercised in full, RR Investors and RR Investors II will hold 2,459,174 and 98,369 shares of common stock, respectively, after this offering. Mr. Harvey disclaims beneficial ownership of these shares except to the extent of Mr. Harvey’s pecuniary interest therein. |
| (13) | Includes 1,000 shares of common stock subject to options exercisable within 60 days of October 5, 2003. |
| (14) | Includes 47,716 shares of common stock subject to options exercisable within 60 days of October 5, 2003. |
61
Our authorized capital stock consists of 30,000,000 shares of common stock, $0.001 par value per share, and 3,000,000 shares of preferred stock, par value $0.001 per share. As of October 5, 2003, there were 15,206,074 shares of common stock outstanding, held of record by approximately 2,300 stockholders, and options to purchase 780,269 shares of common stock.
Common stock
Under our amended and restated certificate of incorporation, the holders of common stock are entitled to one vote per share on all matters to be voted on by the stockholders. After payment of any dividends due and owing to the holders of preferred stock, holders of common stock are entitled to receive dividends declared by the board of directors out of funds legally available for dividends. In the event of our liquidation, dissolution or winding up, holders of common stock are entitled to share in all assets remaining after payment of liabilities and liquidation preferences of outstanding shares of preferred stock. Holders of common stock have no preemptive, conversion, subscription or other rights. There are no redemption or sinking fund provisions applicable to the common stock. All outstanding shares of common stock are, and all shares of common stock to be outstanding upon completion of this offering will be, fully paid and nonassessable.
Preferred stock
In accordance with our amended and restated certificate of incorporation, our board of directors has the authority, without further action by the stockholders, to issue up to 3,000,000 shares of preferred stock. Our board of directors may issue preferred stock in one or more series and may determine the rights, preferences, privileges, qualifications and restrictions granted to or imposed upon the preferred stock, including dividend rights, conversion rights, voting rights, rights and terms of redemption, liquidation preferences and sinking fund terms, any or all of which may be greater than the rights of the common stock. The issuance of preferred stock could adversely affect the voting power of holders of common stock and reduce the likelihood that common stockholders will receive dividend payments and payments upon liquidation. The issuance of preferred stock could also have the effect of decreasing the market price of the common stock and could delay, deter or prevent a change in control of our company. We have no present plans to issue any shares of preferred stock.
Registration rights
Pursuant to a registration rights agreement between us and certain of our stockholders, if at any time we propose to register our common stock under the Securities Act for our own account or the account of any of our stockholders or both, the stockholders party to the registration rights agreement are entitled to notice of the registration and to include registrable shares in the offering, provided that the underwriters of that offering do not limit the number of shares included in the registration. After this offering, the stockholders with these registration rights will hold an aggregate of up to 5,464,144 shares of our common stock. We are required to bear substantially all costs incurred in these registrations, other than underwriting discounts and commissions. The registration rights described above could result in substantial future expenses for us and adversely affect any future equity or debt offerings.
Anti-takeover provisions
Delaware law
We are governed by the provisions of Section 203 of the Delaware General Corporation Law. In general, Section 203 prohibits a public Delaware corporation from engaging in a “business combination” with an “interested stockholder” for a period of three years after the date of the transaction in which the person became an interested stockholder, unless the business combination is approved in a prescribed manner. A “business combination” includes mergers, asset sales or other transactions resulting in a financial benefit to the interested stockholder. An “interested stockholder” is a person who, together with affiliates and associates, currently owns, or within the past three years, owned 15.0% or more of the company’s voting stock. The statute could delay, defer or prevent a change in control of our company.
62
Certificate of incorporation and bylaw provisions
Various provisions contained in our amended and restated certificate of incorporation and bylaws could delay or discourage some transactions involving an actual or potential change in control of us or our management and may limit the ability of stockholders to remove current management or approve transactions that stockholders may deem to be in their best interests and could adversely affect the price of our common stock. These provisions:
| • | authorize our board of directors to establish one or more series of preferred stock, the terms of which can be determined by the board of directors at the time of issuance; |
| • | divide our board of directors into three classes of directors, with each class serving a staggered three-year term. As the classification of the board of directors generally increases the difficulty of replacing a majority of the directors, it may tend to discourage a third party from making a tender offer or otherwise attempting to obtain control of us and may maintain the composition of the board of directors; |
| • | do not provide for cumulative voting in the election of directors unless required by applicable law. Under cumulative voting, a minority stockholder holding a sufficient percentage of a class of shares may be able to ensure the election of one or more directors; |
| • | provide that a director may be removed from our board of directors only for cause, and then only by a supermajority vote of the outstanding shares; |
| • | require that any action required or permitted to be taken by our stockholders must be effected at a duly called annual or special meeting of stockholders and may not be effected by any consent in writing; |
| • | state that special meetings of our stockholders may be called only by the chairman of the board of directors, our chief executive officer, by the board of directors after a resolution is adopted by a majority of the total number of authorized directors, or by the holders of not less than 10.0% of our outstanding voting stock; |
| • | provide that the chairman or other person presiding over any stockholder meeting may adjourn the meeting whether or not a quorum is present at the meeting; |
| • | establish advance notice requirements for submitting nominations for election to the board of directors and for proposing matters that can be acted upon by stockholders at a meeting; |
| • | provide that certain provisions of our certificate of incorporation can be amended only by supermajority vote of the outstanding shares, and that our bylaws can be amended only by supermajority vote of the outstanding shares or our board of directors; |
| • | allow our directors, not our stockholders, to fill vacancies on our board of directors; and |
| • | provide that the authorized number of directors may be changed only by resolution of the board of directors. |
Listing
Our common stock is listed for quotation on The Nasdaq Stock Market’s National Market under the trading symbol “RRGB.”
Transfer agent and registrar
The transfer agent and registrar for our common stock is American Stock Transfer & Trust Company.
63
SHARES ELIGIBLE FOR FUTURE SALE
Future sales of substantial amounts of common stock in the public market could adversely affect market prices prevailing from time to time. Upon completion of this offering, we will have outstanding an aggregate of 15,956,074 shares of common stock. Of these shares, 10,143,594 will be freely tradable without restriction or further registration under the Securities Act, except that any shares purchased by our “affiliates”, as that term is defined in Rule 144 of the Securities Act, may generally only be sold pursuant to an effective registration statement under the Securities Act or in compliance with the limitations of Rule 144 described below.
Sales of restricted shares
After the offering, our affiliates will hold approximately 5,097,377 shares of common stock which are subject to restrictions on sale under Rule 144. Red Robin, as well as our directors, officers and significant stockholders (who together will beneficially own 5,245,772 shares after the offering), have agreed not to sell or otherwise dispose of any of their shares for a period of 90 days after the date of this prospectus without the prior written consent of Banc of America Securities LLC. The consent may be given at any time without notice to the public market.
In general, under Rule 144 as currently in effect, a person (or persons whose shares are aggregated) who has beneficially owned restricted shares for at least one year (including the holding period of any prior owner, except if the prior owner was an affiliate) or an affiliate selling any shares, would be entitled to sell within any three-month period a number of shares that does not exceed the greater of: (a) one percent of the number of shares of common stock then outstanding (which will equal approximately 159,561 shares immediately after the offering); or (b) the average weekly trading volume of the common stock on the Nasdaq National Market during the four calendar weeks preceding the filing of a notice on Form 144 with respect to the sale. Sales under Rule 144 are also subject to manner of sale provisions and notice requirements and to the availability of current public information about us. Under Rule 144(k), a person who is not deemed to have been an affiliate of ours at any time during the 90 days preceding a sale, and who has beneficially owned the shares proposed to be sold for at least two years (including the holding period of any prior owners except a prior owner who was an affiliate), is entitled to sell its shares without complying with the manner of sale, public information, volume limitation or notice provisions of Rule 144; therefore, unless otherwise restricted, “144(k) shares” have been eligible for sale since the completion of our initial public offering.
Registration rights
Upon completion of this offering, holders of up to 5,464,144 shares of our common stock will be entitled to certain rights with respect to the registration of their shares under the Securities Act. See “Description of Capital Stock — Registration Rights.” Except for shares purchased by affiliates, registration of their shares under the Securities Act would result in these shares becoming freely tradable without restriction under the Securities Act immediately upon the effectiveness of the registration.
Stock options and stock plans
We filed a registration statement on Form S-8 on October 9, 2002 under the Securities Act covering:
| • | up to 480,408 shares of common stock reserved for issuance upon exercise of options outstanding as of the filing date of the registration statement; |
| • | up to 900,000 shares of common stock that may be issued with respect to awards granted under our 2002 stock incentive plan following the filing date of the registration statement; and |
| • | up to 300,000 shares of common stock that may be issued to our employees pursuant to our employee stock purchase plan following the filing date of the registration statement. |
Shares registered under this registration statement will, once issued, be available for sale in the open market, subject to the timing and volume limitations of Rule 144 with regard to our affiliates or Rule 701 under the Securities Act.
64
U.S. FEDERAL TAX CONSIDERATIONS FOR NON-U.S. HOLDERS
The following is a general discussion of certain U.S. federal income and estate tax consequences of the acquisition, ownership, and disposition of our common stock purchased pursuant to this offering by a beneficial owner that, for U.S. federal income tax purposes, is a non-U.S. holder. As used in this prospectus, the term “non-U.S. holder” is a person that is not, for U.S. Federal income tax purposes:
| • | an individual who is a citizen or resident of the United States; |
| • | a corporation (including any entity treated as a corporation for U.S. tax purposes) or partnership (including any entity treated as a partnership for U.S. tax purposes) created or organized in the United States or under the laws of the United States or of any political subdivision of the United States, other than a partnership treated as foreign under U.S. Treasury regulations; |
| • | an estate the income of which is subject to U.S. federal income taxation regardless of its source; or |
| • | a trust, in general, if its administration is subject to the primary supervision of a U.S. court and one or more U.S. persons have the authority to control all of its substantial decisions, or if it has a valid election in effect under applicable U.S. Treasury regulations to be treated as a U.S. person. |
This discussion assumes that you will hold our common stock issued pursuant to this offering as a capital asset within the meaning of the Internal Revenue Code of 1986, as amended, or the Code. This discussion does not address all aspects of taxation that may be relevant to particular non-U.S. holders in light of their personal investment or tax circumstances or to persons that are subject to special tax rules. In particular, this description of U.S. tax consequences does not address:
| • | U.S. state and local or non-U.S. tax consequences; |
| • | specific facts and circumstances that may be relevant to a particular non-U.S. holder’s tax position, including, if the non-U.S. holder is an entity that is treated as a partnership for U.S. tax purposes, the U.S. tax consequences of holding and disposing our common stock may be affected by determinations made at the partner level; |
| • | the tax consequences for the shareholders, partners or beneficiaries of a non-U.S. holder; |
| • | special tax rules that may apply to some non-U.S. holders, including without limitation, banks, insurance companies, financial institutions, broker-dealers, tax-exempt entities, or U.S. expatriates; or |
| • | special tax rules that may apply to a non-U.S. holder that holds our common stock as part of a straddle, hedge or conversion transaction. |
This discussion is based on current provisions of the Code, U.S. Treasury regulations, judicial opinions, published positions of the U.S. Internal Revenue Service, or the IRS, and other applicable authorities, all as in effect on the date hereof and all of which are subject to differing interpretations or change, possibly with retroactive effect. We have not sought, and will not seek, any ruling from the IRS or any opinion of counsel with respect to the tax consequences discussed herein, and there can be no assurance that the IRS will not take a position contrary to the tax consequences discussed below or that any position taken by the IRS would not be sustained. Furthermore, this discussion does not give a detailed discussion of any state, local or foreign tax considerations.
We urge you to consult your tax advisor about the U.S. federal tax consequences of acquiring, holding or disposing our common stock, as well as any tax consequences that may arise under the laws of any foreign, state, local or other taxing jurisdiction or under any applicable tax treaty.
65
Dividends
We do not anticipate paying cash dividends on our common stock in the foreseeable future. If dividends are paid to non-U.S. holders on shares of our common stock, however, such dividends will generally be subject to withholding of U.S. federal income tax at the rate of 30.0% or such lower rate as may be specified by an applicable income tax treaty. Non-U.S. holders should consult their tax advisors regarding their entitlement to benefits under an applicable income tax treaty and the manner of claiming the benefits of such treaty (including, without limitation, the need to obtain a U.S. taxpayer identification number).
Dividends that are effectively connected with a non-U.S. holder’s conduct of a trade or business in the United States, directly or through an entity treated as a partnership for U.S. tax purposes, or, if provided in an applicable income tax treaty, dividends that are attributable to a permanent establishment in the United States, are not subject to the U.S. withholding tax, but instead are subject to U.S. federal income tax on a net income basis at graduated rates applicable to dividends. Certain certification and disclosure requirements must be complied with in order for effectively connected income or income attributable to a permanent establishment to be exempt from withholding. Any effectively connected dividends or dividends attributable to a permanent establishment received by a non-U.S. holder that is treated as a foreign corporation for U.S. tax purposes may be subject to an additional “branch profits tax” at a 30.0% rate or such lower rate as may be specified by an applicable income tax treaty.
A non-U.S. holder who claims the benefit of an applicable income tax treaty rate generally will be required to satisfy applicable certification and other requirements. However,
| • | in the case of common stock held by a foreign partnership, the certification requirement will generally be applied to the partners of the partnership and the partnership will be required to provide certain information; |
| • | in the case of common stock held by a foreign trust, the certification requirement will generally be applied to the trust or the beneficial owners of the trust depending on whether the trust is a “foreign complex trust,” “foreign simple trust,” or “foreign grantor trust” as defined in the U.S. Treasury regulations; and |
| • | look-through rules will apply for tiered partnerships, foreign simple trusts and foreign grantor trusts. |
A non-U.S. holder that is a foreign partnership or a foreign trust is urged to consult its own tax advisor regarding its status under these U.S. Treasury regulations and the certification requirements applicable to it.
A non-U.S. holder that is eligible for a reduced rate of U.S. federal withholding tax under an income tax treaty may obtain a refund or credit of any excess amounts withheld by filing an appropriate claim for a refund with the IRS.
Gain on disposition
A non-U.S. holder will generally not be subject to U.S. federal income tax, including by way of withholding, on gain recognized on a sale, exchange or other disposition of our common stock unless any one of the following is true:
| 1. | The non-U.S. holder is a nonresident alien individual who is present in the United States for 183 days or more in the taxable year of the sale, exchange or other disposition and certain other requirements are met; |
| 2. | The gain is effectively connected with the non-U.S. holder’s conduct of a trade or business in the United States, directly or through an entity treated as a partnership for U.S. tax purposes and, if an applicable tax treaty requires, attributable to a U.S. permanent establishment of such non-U.S. holder; or |
66
| 3. | Our common stock constitutes a U.S. real property interest by reason of our status as a “U.S. real property holding corporation” for U.S. federal income tax purposes at any time during the shorter of (i) the period during which the non-U.S. holder holds our common stock or (ii) the 5-year period ending on the date the non-U.S. holder disposes of our common stock. As long as our common stock is regularly traded on an established securities market for tax purposes, our common stock will not be treated as a U.S. real property interest with respect to a non-U.S. holder that has not beneficially owned more than 5.0% of such regularly traded common stock at any time within the five-year period preceding such disposition. We believe that we are a U.S. real property holding corporation and will remain a U.S. real property holding corporation for the foreseeable future. See discussion below. |
Non-U.S. holders described in clause (1) above are taxed on their gains (including gains from sales of our common stock and net of applicable U.S. losses from sales or exchanges of other capital assets incurred during the year) at a flat rate of 30.0% or such lower rate as may be specified by an applicable income tax treaty. Non-U.S. holders described in clause (2) or (3) above will be subject to tax on the net gain derived from the sale under regular graduated U.S. federal income tax rates. If a non-U.S. holder described in clause (2) is a corporation, it may be subject to the branch profits tax at a rate equal to 30.0% of its effectively connected earnings and profits or at such lower rate as may be specified by an applicable income tax treaty.
In general, we will be treated as a “U.S. real property holding corporation” if the fair market value of our “U.S. real property interests” equals or exceeds 50.0% of the sum of the fair market value of our worldwide real property interests and our other assets used or held for use in a trade or business. The determination of the fair market value of our assets and, therefore, whether we are a U.S. real property holding corporation at any given time, will depend on the particular facts and circumstances applicable at the time.
However, even if we are or have been a U.S. real property holding corporation, a non-U.S. holder which did not beneficially own, directly or indirectly, more than 5.0% of the total fair market value of our common stock at any time during the shorter of the five-year period ending on the date of disposition or the period that our common stock was held by the non-U.S. holder (a “non-5.0% holder”) and which is not otherwise taxed under any other circumstances described above, generally will not be taxed on any gain realized on the disposition of our common stock if, at any time during the calendar year of the disposition, our common stock was regularly traded on an established securities market within the meaning of the applicable U.S. Treasury regulations.
Our common stock is listed on the The Nasdaq Stock Market’s National Market under the symbol RRGB. Although not free from doubt, our common stock should be considered to be regularly traded on an established securities market for any calendar quarter during which it is regularly quoted on NASDAQ by brokers or dealers that hold themselves out to buy or sell our common stock at the quoted price. If our common stock were not considered to be regularly traded on NASDAQ at any time during the applicable calendar year, then a non-5.0% holder would be taxed for U.S. federal income tax purposes on any gain realized on the disposition of our common stock on a net income basis as if the gain were effectively connected with the conduct of a U.S. trade or business by the non-5.0% holder during the taxable year and, in such case, the person acquiring our common stock from a non-5.0% holder generally would have to withhold 10.0% of the amount of the proceeds of the disposition. Such withholding may be reduced or eliminated pursuant to a withholding certificate issued by the IRS in accordance with applicable U.S. Treasury regulations. We urge all non-U.S. holders to consult their own tax advisors regarding the application of these rules to them.
U.S. federal estate taxes
Our common stock beneficially owned or treated as beneficially owned by an individual who at the time of death is a non-U.S. holder will be included in his or her estate for U.S. federal estate tax purposes, unless an applicable estate tax treaty provides otherwise and, therefore, may be subject to U.S. federal estate tax.
67
Information reporting and backup withholding
Under U.S. Treasury regulations, we must report annually to the IRS and to each non-U.S. holder the amount of dividends paid to such non-U.S. holder and the tax withheld with respect to those dividends. These information reporting requirements apply even if withholding was not required because the dividends were effectively connected dividends or withholding was reduced or eliminated by an applicable tax treaty. Pursuant to an applicable tax treaty, that information may also be made available to the tax authorities in the country in which the non-U.S. holder resides.
The gross amount of dividends paid to a non-U.S. holder that fails to certify its non-U.S. holder status in accordance with applicable U.S. Treasury regulations generally will be reduced by backup withholding at the applicable rate, currently 28.0%, subject to a schedule that increases the rate to 31.0% in 2011.
A non-U.S. holder whose ownership of common stock is not effectively connected with the conduct of a trade or business in the United States, a “non-ECI holder,” is required to certify its non-U.S. status and meet certain other conditions in order to avoid information reporting and backup withholding on disposition proceeds where the transaction is effected by or through a U.S. office of a broker.
U.S. information reporting and backup withholding generally will not apply to a payment of proceeds of a disposition of common stock by a non-ECI holder where the transaction is effected outside the United States through a non-U.S. office of a non-U.S. broker. However, information reporting requirements, but not backup withholding, generally will apply to such a payment if the broker is (i) a U.S. person; (ii) a foreign person that derives 50.0% or more of its gross income for certain periods from the conduct of a trade or business in the United States; (iii) a controlled foreign corporation as defined in the Code; or (iv) a foreign partnership with certain U.S. connections, unless the broker has documentary evidence in its records that the holder is a non-U.S. holder and certain conditions are met or the holder otherwise establishes an exemption.
Backup withholding is not an additional tax. Amounts that we withhold under the backup withholding rules may be refunded or credited against the non-U.S. holder’s U.S. federal income tax liability if certain required information is furnished to the IRS. Non-U.S. holders should consult their own tax advisors regarding application of backup withholding in their particular circumstance and the availability of and procedure for obtaining an exemption from backup withholding under current U.S. Treasury regulations.
New Tax Legislation
As part of the Jobs and Growth Tax Relief Reconciliation Act of 2003, or the Act, signed into law on May 28, 2003, the maximum tax rate on qualified dividends paid to individuals, trusts and estates was reduced to 15.0% for tax years 2003 through 2008. We expect our dividends to be qualified dividends with respect to an individual, estate, or trust whose ownership of our common stock is effectively connected with the conduct of a trade or business in the United States, a “qualified ECI holder,” as long as the qualified ECI holder has held our common stock for more than 60 days. In addition, the Act established a maximum tax rate of 15.0% on net long-term capital gains of qualified ECI holders effective for gains properly taken into account after May 5, 2003.
The foregoing discussion is only a summary of certain U.S. federal income and estate tax consequences of the ownership, sale or other disposition of our common stock by non-U.S. holders. You are urged to consult your own tax advisor with respect to the particular tax consequences to you of ownership and disposition of our common stock, including the effect of any U.S., state, local, non-U.S. or other tax laws and any applicable income or estate tax treaty.
68
We and the selling stockholders are offering the shares of common stock described in this prospectus through a number of underwriters. Banc of America Securities LLC and Wachovia Capital Markets, LLC are the representatives of the underwriters. We and the selling stockholders have entered into a firm commitment underwriting agreement with the representatives. Subject to the terms and conditions of the underwriting agreement, we and the selling stockholders have agreed to sell to the underwriters, and each underwriter has agreed to purchase the number of shares of common stock listed next to its name in the following table:
| Underwriter |
Number of Shares | |
| Banc of America Securities LLC |
||
| Wachovia Capital Markets, LLC. |
||
| U.S. Bancorp Piper Jaffray Inc. |
||
| SunTrust Capital Markets, Inc. |
||
| McDonald Investments Inc. |
||
| Harris Nesbitt Corp. |
||
| Total |
||
The underwriting agreement is subject to a number of terms and conditions and provides that the underwriters must buy all of the shares if they buy any of them. The underwriters will sell the shares to the public when and if the underwriters buy the shares from us and the selling stockholders.
The underwriters initially will offer the shares to the public at the price specified in the cover page of this prospectus. The underwriters may allow a concession of not more than $ per share to selected dealers. The underwriters may also allow, and those dealers may re-allow a concession of not more than $ per share to some other dealers. If all the shares are not sold at the public offering price, the underwriters may change the public offering price and the other selling terms. The common stock is offered subject to a number of conditions, including:
| • | receipt and acceptance of the common stock by the underwriters; and |
| • | the underwriters’ right to reject orders in whole or in part. |
Over-Allotment Option. Some of the selling stockholders have granted the underwriters an over-allotment option to buy up to additional shares of our common stock at the same price per share as they are paying for the shares shown in the table above. These additional shares would cover sale of shares by the underwriters which exceed the total number of shares shown in the table above. The underwriters may exercise this option at any time within 30 days after the date of this prospectus. To the extent that the underwriters exercise this option, each underwriter will purchase additional shares from these selling stockholders in approximately the same proportion as it purchased the shares shown in the table above. If purchased, the additional shares will be sold by the underwriters on the same terms as those on which the other shares are sold. We will pay the expenses associated with the exercise of this option.
Discount and Commissions. The following table shows the per share and total underwriting discounts and commissions to be paid to the underwriters by us and by the selling stockholders. These amounts are shown assuming no exercise and full exercise of the underwriters’ option to purchase additional shares.
We estimate that the expenses of the offering to be paid by us, not including underwriting discounts and commissions, will be approximately $750,000.
69
| Paid by Us |
Paid by the Selling Stockholders | |||||||||||
| No Exercise |
Full Exercise |
No Exercise |
Full Exercise | |||||||||
| Per Share |
$ | $ | $ | $ | ||||||||
| Total |
$ | $ | $ | $ | ||||||||
We have agreed with the selling stockholders to reimburse them for a portion of the underwriting discounts and commissions to be paid by them in the amount of approximately $ per share, or $ in the aggregate.
Listing. Our common stock is quoted on the Nasdaq National Market under the symbol “RRGB.”
Stabilization. In connection with this offering, the underwriters may engage in activities that stabilize, maintain or otherwise affect the price of our common stock, including:
| • | stabilizing transactions; |
| • | short sales; |
| • | syndicate covering transactions; |
| • | imposition of penalty bids; and |
| • | purchases to cover positions created by short sales. |
Stabilizing transactions consists of bids or purchases made for the purpose of preventing or retarding a decline in the market price of our common stock while this offering is in progress. Stabilizing transactions may include making short sales of our common stock, which involves the sale by the underwriters of a greater number of shares of common stock than they are required to purchase in this offering, and purchasing shares of common stock from us or on the open market to cover positions created by short sales. Short sales may be “covered” shorts, which are short positions in an amount not greater than the underwriters’ over-allotment option referred to above, or may be “naked” shorts, which are short positions in excess of that amount. Syndicate covering transactions involve purchases of our common stock in the open market after the distribution has been completed in order to cover syndicate short positions.
The underwriters may close out any covered short position either by exercising their over-allotment option, in whole or in part, or by purchasing shares in the open market. In making this determination, the underwriters will consider, among other things, the price of shares available for purchase in the open market compared to the price at which the underwriters may purchase shares through the over-allotment option.
A naked short position is more likely to be created if the underwriters are concerned that there may be downward pressure on the price of the common stock in the open market that could adversely affect investors who purchased in this offering. To the extent that the underwriters create a naked short position, they will purchase shares in the open market to cover the position.
The representatives also may impose a penalty bid on underwriters and dealers participating in the offering. This means that the representatives may reclaim from any syndicate members or other dealers participating in the offering the underwriting discount, commissions or the selling concession on shares sold by them and purchased by the representatives in stabilizing or short covering transactions.
These activities may have the effect of raising or maintaining the market price of our common stock or preventing or retarding a decline in the market price of our common stock. As a result of these activities, the price of our common stock may be higher than the price that otherwise might exist in the open market. If the underwriters commence the activities, they may discontinue them at any time. The underwriters may carry out these transactions on the Nasdaq National Market, in the over-the-counter market or otherwise.
70
In connection with this offering, some underwriters and any selling group members who are qualified market makers on the Nasdaq National Market may engage in passive market making transactions in our common stock on the Nasdaq National Market. Passive market making is allowed during the period when the SEC’s rules would otherwise prohibit market activity by the underwriters and dealers who are participating in this offering. Passive market making may occur during the business day before the pricing of this offering, before the commencement of offers or sales of the common stock. A passive market maker must comply with applicable volume and price limitations and must be identified as a passive market maker. In general, a passive market maker must display its bid at a price not in excess of the highest independent bid for our common stock; but if all independent bids are lowered below the passive market maker’s bid, the passive market maker must also lower its bid once it exceeds specified purchase limits. Net purchases by a passive market maker on each day are limited to a specified percentage of the passive market maker’s average daily trading volume in our common stock during the specified period and must be discontinued when that limit is reached. Passive market making may cause the price of our common stock to be higher than the price that otherwise would exist in the open market in the absence of those transactions. The underwriters and dealers are not required to engage in a passive market making and may end passive market making activities at any time.
Lock-up Agreements. We, our directors, executive officers and significant stockholders have entered into lock-up agreements with the underwriters. Under these agreements, subject to exceptions, we may not issue any new shares of common stock, and those holders of stock may not, directly or indirectly, offer, sell, contract to sell, pledge or otherwise dispose of or hedge any common stock or securities convertible into or exchangeable for shares of common stock, or publicly announce the intention to do any of the foregoing, without the prior written consent of Banc of America Securities LLC for a period of 90 days from the date of this prospectus. This consent may be given at any time without notice to the public market. In addition, during this 90 day period, we have also agreed not to file any registration statement for any shares of common stock or any securities convertible into or exercisable or exchangeable for common stock without the prior written consent of Banc of America Securities LLC.
Indemnification. We and the selling stockholders will indemnify the underwriters against some liabilities, including liabilities under the Securities Act. If we and the selling stockholders are unable to provide this indemnification, we and the selling stockholders will contribute to payments the underwriters may be required to make in respect of those liabilities.
Conflicts/Affiliates. The underwriters and their affiliates have provided, and may in the future provide, various investment banking, commercial banking and other financial services for us and certain of the selling stockholders for which services they have received, and may in the future receive, customary fees. In addition, Banc of America Securities LLC and its affiliates and some of the other underwriters and their affiliates have owned, currently own or may own, equity or equity-like securities of us. Further, some of the underwriters and their affiliates serve in various capacities under our revolving credit facility, including, as lead arranger, administrative agent, documentation agent and lender. Because more than 10% of the net proceeds of this offering will be received by affiliates of underwriters participating in the offering, the offering will be conducted in accordance with NASD Conduct Rule 2710(c)(8).
71
The validity of the shares of our common stock offered in this prospectus has been passed upon for us by O’Melveny & Myers LLP. One of our directors, Gary J. Singer, is a partner of O’Melveny & Myers LLP and owns 5,518 shares of our common stock and options to purchase 2,000 shares of our common stock. Fried, Frank, Harris, Shriver & Jacobson (a partnership including professional corporations), New York, New York, will pass upon certain legal matters in connection with this offering for the underwriters.
The financial statements as of December 29, 2002 and December 30, 2001, and for each of the three years in the period ended December 29, 2002, included and incorporated by reference in this prospectus have been audited by Deloitte & Touche LLP, independent auditors, as stated in their reports (which reports express an unqualified opinion and include an explanatory paragraph referring to the change in the method of accounting for goodwill and intangible assets in 2002), which are included and incorporated by reference herein, and have been so included in reliance upon the reports of such firm given upon their authority as experts in accounting and auditing.
72
We have filed with the SEC a registration statement on Form S-3 under the Securities Act with respect to the shares of common stock offered by this prospectus.
We are subject to the informational requirements of the Exchange Act and are required to file annual and quarterly reports, proxy statements and other information with the SEC. You can inspect and copy reports and other information filed by us with the SEC at the SEC’s Public Reference Room at 450 Fifth Street, N.W., Washington, D.C. 20549. You may also obtain information on the operation of the Public Reference Room by calling the SEC at 1-800-SEC-0300. The SEC also maintains an Internet site at http://www.sec.gov that contains reports, proxy and information statements regarding issuers, including us, that file electronically with the SEC.
We are “incorporating by reference” into this prospectus certain information we file with the SEC, which means that we are disclosing important information to you by referring you to those documents. The information incorporated by reference is deemed to be part of this prospectus, except for any information superseded by information contained directly in this prospectus. These documents contain important information about us and our finances. This prospectus incorporates by reference the following documents (File No. 0-49916):
| • | Our annual report on Form 10-K for the year ended December 29, 2002, filed with the SEC on March 28, 2003; |
| • | Information under the captions “Stock Ownership,” “Board of Directors,” “Executive Compensation,” “Stock Performance Graph,” “Related Party Transactions,” “Audit Committee Report” and “Independent Auditors” included in our Revised Definitive Proxy Statement for our 2003 Annual Meeting of Stockholders, filed with the SEC on April 21, 2003; |
| • | Item 5 of our current report on Form 8-K dated May 20, 2003, filed with the SEC on May 22, 2003; |
| • | Our quarterly report on Form 10-Q for the period ended April 20, 2003, filed with the SEC on May 27, 2003; |
| • | Our quarterly report on Form 10-Q for the period ended July 13, 2003, filed with the SEC on August 18, 2003; |
| • | Our quarterly report on Form 10-Q for the period ended October 5, 2003, filed with the SEC on November 3, 2003; |
| • | Items 5 and 7 of our current report on Form 8-K dated November 3, 2003, filed with the SEC on November 4, 2003; and |
| • | The description of our common stock contained in our Registration Statement on Form 8-A, filed with the SEC on July 16, 2002. |
All documents we file with the SEC pursuant to Section 13(a), 13(c), 14 or 15(d) of the Securities Exchange Act from the date of this prospectus to the end of the offering of the common stock under this prospectus shall also be deemed to be incorporated herein by reference and will automatically update information in this prospectus.
As permitted by the rules and regulations of the SEC, this prospectus, which is a part of the registration statement, omits various information, exhibits, schedules and undertakings included in the registration statement. For further information pertaining to us and the common stock offered under this prospectus, reference is made to the registration statement and the attached exhibits and schedules. Although required material information has been presented in this prospectus, statements contained in this prospectus as to the contents or provisions of any contract or other document referred to in this prospectus may be summary in nature, and in each instance reference is made to the copy of the contract or other document filed as an exhibit to the registration statement, and each statement is qualified in all respects by this reference.
We will provide to you, at no cost, upon your written or oral request, a copy of any or all of the documents that we incorporate by reference, including exhibits. Please direct your request to: Red Robin Gourmet Burgers, Inc., Legal and Shareholder Services, 5575 DTC Parkway, Suite 110, Greenwood Village, Colorado 80111, (303) 846-6000. Exhibits to the filings will not be sent, however, unless those exhibits have specifically been incorporated by reference in this prospectus.
73
| Page | ||
| RED ROBIN GOURMET BURGERS, INC. |
||
| F-2 | ||
| Consolidated Balance Sheets — December 30, 2001, December 29, 2002 and October 5, 2003 (unaudited) |
F-3 | |
| F-4 | ||
| F-5 | ||
| F-6 | ||
| F-7 | ||
F-1
The Board of Directors and Stockholders
Red Robin Gourmet Burgers, Inc.
Greenwood Village, Colorado
We have audited the accompanying consolidated balance sheets of Red Robin Gourmet Burgers, Inc. (the Company) and subsidiaries as of December 29, 2002 and December 30, 2001, and the related consolidated statements of income, stockholders’ equity and cash flows for the years ended December 29, 2002, December 30, 2001 and December 31, 2000. These financial statements are the responsibility of the Company’s management. Our responsibility is to express an opinion on these financial statements based on our audits.
We conducted our audits in accordance with auditing standards generally accepted in the United States of America. Those standards require that we plan and perform the audit to obtain reasonable assurance about whether the financial statements are free of material misstatement. An audit includes examining, on a test basis, evidence supporting the amounts and disclosures in the financial statements. An audit also includes assessing the accounting principles used and significant estimates made by management, as well as evaluating the overall financial statement presentation. We believe that our audits provide a reasonable basis for our opinion.
In our opinion, such consolidated financial statements present fairly, in all material respects, the financial position of Red Robin Gourmet Burgers, Inc. and subsidiaries as of December 29, 2002 and December 30, 2001, and the results of their operations and their cash flows for the years ended December 29, 2002, December 30, 2001 and December 31, 2000 in conformity with accounting principles generally accepted in the United States of America.
As discussed in Note 2 to the consolidated financial statements, the Company adopted Statement of Financial Accounting Standard No. 142 which changed the method of accounting for goodwill and intangible assets in 2002.
/s/ DELOITTE & TOUCHE LLP
Denver, Colorado
March 7, 2003, except for note 19,
as to which the date is May 20, 2003
F-2
RED ROBIN GOURMET BURGERS, INC. AND SUBSIDIARIES
CONSOLIDATED BALANCE SHEETS
(In thousands, except share amounts)
| December 30, 2001 |
December 29, 2002 |
October 5, 2003 |
||||||||||
| (unaudited) | ||||||||||||
| Assets |
||||||||||||
| Current Assets: |
||||||||||||
| Cash and cash equivalents |
$ | 18,992 | $ | 4,797 | $ | 3,222 | ||||||
| Accounts receivable, net |
2,697 | 1,642 | 1,348 | |||||||||
| Inventories |
2,746 | 3,289 | 3,888 | |||||||||
| Prepaid expenses and other current assets |
2,073 | 3,118 | 3,622 | |||||||||
| Income tax refund receivable |
25 | 155 | — | |||||||||
| Deferred tax asset |
1,667 | 1,055 | 1,055 | |||||||||
| Restricted current assets — marketing funds |
681 | 617 | 743 | |||||||||
| Total current assets |
28,881 | 14,673 | 13,878 | |||||||||
| Real estate held for sale |
843 | 843 | 843 | |||||||||
| Property and equipment, net |
82,451 | 110,176 | 142,522 | |||||||||
| Deferred tax asset |
8,652 | 8,141 | 8,164 | |||||||||
| Goodwill, net |
22,555 | 25,720 | 25,720 | |||||||||
| Other intangible assets, net |
7,034 | 8,354 | 8,062 | |||||||||
| Other assets, net |
4,025 | 1,719 | 3,271 | |||||||||
| Total assets |
$ | 154,441 | $ | 169,626 | $ | 202,460 | ||||||
| Liabilities and Stockholders’ Equity |
||||||||||||
| Current Liabilities: |
||||||||||||
| Trade accounts payable |
$ | 5,669 | $ | 8,343 | $ | 12,647 | ||||||
| Accrued payroll and payroll-related liabilities |
7,254 | 7,627 | 10,639 | |||||||||
| Unredeemed gift certificates |
2,341 | 3,110 | 2,025 | |||||||||
| Accrued liabilities |
7,201 | 6,336 | 8,407 | |||||||||
| Accrued liabilities — marketing funds |
681 | 617 | 743 | |||||||||
| Current portion of long-term debt and capital lease obligations |
5,078 | 1,828 | 1,359 | |||||||||
| Total current liabilities |
28,224 | 27,861 | 35,820 | |||||||||
| Deferred rent payable |
4,229 | 4,624 | 5,112 | |||||||||
| Long-term debt and capital lease obligations |
75,010 | 38,152 | 50,184 | |||||||||
| Commitments and contingencies |
— | — | — | |||||||||
| Stockholders’ Equity: |
||||||||||||
| Common stock; $.001 par value: 30,000,000 shares authorized; 10,090,312, 15,108,172 and 15,206,074 (unaudited) shares issued and outstanding |
10 | 15 | 15 | |||||||||
| Preferred stock, $.001 par value: 3,000,000 shares authorized; no shares issued and outstanding |
— | — | — | |||||||||
| Additional paid-in capital |
53,455 | 103,142 | 104,048 | |||||||||
| Deferred compensation |
— | (209 | ) | (150 | ) | |||||||
| Receivables from stockholders/officers |
(600 | ) | (6,252 | ) | (6,364 | ) | ||||||
| Accumulated other comprehensive loss, net of tax benefit |
— | (84 | ) | (123 | ) | |||||||
| Retained earnings (accumulated deficit) |
(5,887 | ) | 2,377 | 13,918 | ||||||||
| Total stockholders’ equity |
46,978 | 98,989 | 111,344 | |||||||||
| Total liabilities and stockholders’ equity |
$ | 154,441 | $ | 169,626 | $ | 202,460 | ||||||
See Notes to Consolidated Financial Statements.
F-3
RED ROBIN GOURMET BURGERS, INC. AND SUBSIDIARIES
CONSOLIDATED STATEMENTS OF INCOME
(In thousands, except per share data)
| Fiscal Year Ended |
Forty Weeks Ended |
|||||||||||||||||||
| December 31, 2000 |
December 30, 2001 |
December 29, 2002 |
October 6, 2002 |
October 5, 2003 |
||||||||||||||||
| (unaudited) | (unaudited) | |||||||||||||||||||
| Revenues: |
||||||||||||||||||||
| Restaurant |
$ | 180,414 | $ | 214,963 | $ | 265,518 | $ | 201,878 | $ | 240,468 | ||||||||||
| Franchise royalties and fees |
8,247 | 9,002 | 8,565 | 6,683 | 6,967 | |||||||||||||||
| Rent revenue |
509 | 520 | 327 | 282 | 369 | |||||||||||||||
| Total revenues |
189,170 | 224,485 | 274,410 | 208,843 | 247,804 | |||||||||||||||
| Costs and Expenses: |
||||||||||||||||||||
| Restaurant operating costs: |
||||||||||||||||||||
| Cost of sales |
43,945 | 50,914 | 61,084 | 46,689 | 56,452 | |||||||||||||||
| Labor |
64,566 | 74,854 | 94,030 | 72,059 | 85,117 | |||||||||||||||
| Operating |
27,960 | 33,195 | 40,428 | 30,587 | 36,362 | |||||||||||||||
| Occupancy |
11,519 | 14,785 | 18,095 | 13,955 | 16,376 | |||||||||||||||
| Restaurant closures and impairment |
1,302 | 36 | 1,133 | — | — | |||||||||||||||
| Depreciation and amortization |
8,237 | 10,491 | 12,883 | 9,417 | 12,110 | |||||||||||||||
| General and administrative |
17,116 | 16,845 | 20,260 | 15,081 | 17,150 | |||||||||||||||
| Franchise development |
3,386 | 3,704 | 3,256 | 2,655 | 2,180 | |||||||||||||||
| Pre-opening costs |
2,506 | 921 | 1,879 | 1,610 | 2,414 | |||||||||||||||
| Gain on lease buy-out |
— | — | (945 | ) | (945 | ) | — | |||||||||||||
| Impairment of real estate held for sale |
— | — | 150 | 150 | — | |||||||||||||||
| Total costs and expenses |
180,537 | 205,745 | 252,253 | 191,258 | 228,161 | |||||||||||||||
| Income from operations |
8,633 | 18,740 | 22,157 | 17,585 | 19,643 | |||||||||||||||
| Other (Income) Expense: |
||||||||||||||||||||
| Interest expense |
6,482 | 7,850 | 5,769 | 4,857 | 2,331 | |||||||||||||||
| Interest income |
(742 | ) | (746 | ) | (398 | ) | (205 | ) | (256 | ) | ||||||||||
| Loss on extinguishment of debt |
— | — | 4,336 | 4,272 | 257 | |||||||||||||||
| Other |
19 | 190 | 105 | 62 | 19 | |||||||||||||||
| Total other expenses |
5,759 | 7,294 | 9,812 | 8,986 | 2,351 | |||||||||||||||
| Income before income taxes |
2,874 | 11,446 | 12,345 | 8,599 | 17,292 | |||||||||||||||
| Provision for income taxes |
12,557 | (3,722 | ) | (4,081 | ) | (3,002 | ) | (5,751 | ) | |||||||||||
| Net income |
$ | 15,431 | $ | 7,724 | $ | 8,264 | $ | 5,597 | $ | 11,541 | ||||||||||
| Net income per share: |
||||||||||||||||||||
| Basic |
$ | 2.07 | $ | 0.77 | $ | 0.67 | $ | 0.49 | $ | 0.76 | ||||||||||
| Diluted |
$ | 2.07 | $ | 0.75 | $ | 0.65 | $ | 0.47 | $ | 0.75 | ||||||||||
| Weighted average shares outstanding: |
||||||||||||||||||||
| Basic |
7,444 | 10,085 | 12,278 | 11,461 | 15,092 | |||||||||||||||
| Diluted |
7,444 | 10,236 | 12,660 | 11,888 | 15,343 | |||||||||||||||
See Notes to Consolidated Financial Statements.
F-4
RED ROBIN GOURMET BURGERS, INC. AND SUBSIDIARIES
CONSOLIDATED STATEMENTS OF STOCKHOLDERS’ EQUITY
(In thousands)
| Common Stock |
Additional Paid-in Capital |
Deferred Compensation |
Receivables From Stockholders/ Officers |
Accumulated Other |
Retained Earnings (Accumulated Deficit) |
Total |
||||||||||||||||||||||
| Shares |
Amount |
|||||||||||||||||||||||||||
| Balance, December 26, 1999 |
2,979 | $ | 3 | $ | 14,177 | $ | — | $ | — | $ | — | $ | (29,042 | ) | $ | (14,862 | ) | |||||||||||
| Common stock issued: |
||||||||||||||||||||||||||||
| For the acquisition of The Snyder Group Company, net of offering costs of $1,959,799 |
1,890 | 2 | 8,999 | — | — | — | — | 9,001 | ||||||||||||||||||||
| For the conversion of debt owed to a related party |
776 | 1 | 4,499 | — | — | — | — | 4,500 | ||||||||||||||||||||
| To affiliates of Quad-C, a related party |
4,310 | 4 | 24,996 | — | — | — | — | 25,000 | ||||||||||||||||||||
| Other |
114 | 664 | — | — | — | — | 664 | |||||||||||||||||||||
| Options exercised for common stock |
7 | 39 | — | — | — | — | 39 | |||||||||||||||||||||
| Issuance of note receivable —stockholder/officer |
— | — | — | — | (300 | ) | — | — | (300 | ) | ||||||||||||||||||
| Net income |
— | — | — | — | — | — | 15,431 | 15,431 | ||||||||||||||||||||
| Balance, December 31, 2000 |
10,076 | 10 | 53,374 | — | (300 | ) | — | (13,611 | ) | 39,473 | ||||||||||||||||||
| Issuance of common stock |
10 | 56 | — | — | — | — | 56 | |||||||||||||||||||||
| Options exercised for common stock |
4 | 25 | — | — | — | — | 25 | |||||||||||||||||||||
| Issuance of note receivable —stockholder/officer |
— | — | — | — | (300 | ) | — | (300 | ) | |||||||||||||||||||
| Net income |
— | — | — | — | — | — | 7,724 | 7,724 | ||||||||||||||||||||
| Balance, December 30, 2001 |
10,090 | 10 | 53,455 | — | (600 | ) | — | (5,887 | ) | 46,978 | ||||||||||||||||||
| Deferred compensation |
289 | (289 | ) | — | — | — | — | |||||||||||||||||||||
| Amortization of deferred compensation |
— | — | — | 80 | — | — | — | 80 | ||||||||||||||||||||
| Issuance of common stock for notes |
922 | 1 | 5,399 | — | (5,400 | ) | — | — | — | |||||||||||||||||||
| Interest on notes from stockholders/officers |
— | — | — | — | (252 | ) | — | — | (252 | ) | ||||||||||||||||||
| Shares issued upon initial public offering, net of offering costs of $5,203,033 |
4,000 | 4 | 42,793 | — | — | — | — | 42,797 | ||||||||||||||||||||
| Options exercised for common stock |
96 | 554 | — | — | — | — | 554 | |||||||||||||||||||||
| Tax benefit on exercise of stock options |
— | — | 652 | — | — | — | — | 652 | ||||||||||||||||||||
| Net income |
— | — | — | — | — | — | 8,264 | 8,264 | ||||||||||||||||||||
| Unrealized loss on cash flow hedge |
— | — | — | — | — | (84 | ) | — | (84 | ) | ||||||||||||||||||
| Comprehensive income |
8,180 | |||||||||||||||||||||||||||
| Balance, December 29, 2002 |
15,108 | 15 | 103,142 | (209 | ) | (6,252 | ) | (84 | ) | 2,377 | 98,989 | |||||||||||||||||
| Amortization of deferred compensation (unaudited) |
— | — | — | 59 | — | — | — | 59 | ||||||||||||||||||||
| Interest on notes from stockholders/officers (unaudited) |
— | — | — | — | (231 | ) | — | — | (231 | ) | ||||||||||||||||||
| Repayment of stockholders/officers notes and related interest (unaudited) |
— | — | — | — | 119 | — | — | 119 | ||||||||||||||||||||
| Options exercised for common stock (unaudited) |
89 | — | 517 | — | — | — | — | 517 | ||||||||||||||||||||
| Tax benefit on exercise of stock options (unaudited) |
— | — | 290 | — | — | — | — | 290 | ||||||||||||||||||||
| Common stock issued through employee Stock purchase plan (unaudited) |
9 | — | 99 | — | — | — | — | 99 | ||||||||||||||||||||
| Net income (unaudited) |
— | — | — | — | — | — | 11,541 | 11,541 | ||||||||||||||||||||
| Unrealized loss on cash flow hedge (unaudited) |
— | — | — | — | — | (39 | ) | — | (39 | ) | ||||||||||||||||||
| Comprehensive income (unaudited) |
11,502 | |||||||||||||||||||||||||||
| Balance, October 5, 2003 (unaudited) |
15,206 | $ | 15 | $ | 104,048 | $ | (150 | ) | $ | (6,364 | ) | $ | (123 | ) | $ | 13,918 | $ | 111,344 | ||||||||||
See Notes to Consolidated Financial Statements.
F-5
RED ROBIN GOURMET BURGERS, INC. AND SUBSIDIARIES
CONSOLIDATED STATEMENTS OF CASH FLOWS
(In thousands)
| Fiscal Year Ended |
Forty Weeks Ended |
|||||||||||||||||||
| December 31, 2000 |
December 30, 2001 |
December 29, 2002 |
October 6, 2002 |
October 5, 2003 |
||||||||||||||||
| (unaudited) | (unaudited) | |||||||||||||||||||
| Cash Flows From Operating Activities: |
||||||||||||||||||||
| Net income |
$ | 15,431 | $ | 7,724 | $ | 8,264 | $ | 5,597 | $ | 11,541 | ||||||||||
| Adjustments to Reconcile Net Income to Net Cash Provided by Operating Activities: |
||||||||||||||||||||
| Amortization of deferred stock-based compensation |
— | — | 80 | 59 | 59 | |||||||||||||||
| Depreciation and amortization |
8,237 | 10,491 | 12,883 | 9,417 | 12,110 | |||||||||||||||
| Amortization of debt issuance costs |
84 | 223 | 360 | 268 | 376 | |||||||||||||||
| Write-off of unamortized debt issuance costs |
— | — | 2,448 | 2,383 | 186 | |||||||||||||||
| Non cash restaurant closure and impairment costs |
1,302 | 36 | 1,133 | — | — | |||||||||||||||
| Impairment of real estate held for sale |
— | — | 150 | 150 | 9 | |||||||||||||||
| Loss (gain) on sale of property and equipment |
(234 | ) | 192 | 17 | 22 | (9 | ) | |||||||||||||
| Non cash gain on lease buyout |
— | — | (452 | ) | (451 | ) | — | |||||||||||||
| Provision for doubtful accounts, net of charge-offs |
1,272 | 698 | 119 | 16 | 10 | |||||||||||||||
| Stock option income tax benefits |
— | — | 652 | 603 | 290 | |||||||||||||||
| Accrued interest on stockholders/officers notes |
— | — | (252 | ) | — | (231 | ) | |||||||||||||
| Provision (benefit) for deferred income taxes |
(13,235 | ) | 1,225 | 1,365 | 938 | — | ||||||||||||||
| Changes in operating assets and liabilities: |
||||||||||||||||||||
| Accounts receivable |
(1,981 | ) | 532 | 905 | 821 | 310 | ||||||||||||||
| Inventories |
(1,052 | ) | (139 | ) | (425 | ) | (360 | ) | (598 | ) | ||||||||||
| Prepaid expenses and other current assets |
(906 | ) | (206 | ) | (882 | ) | 79 | (504 | ) | |||||||||||
| Income tax refund receivable |
(254 | ) | 1,020 | (130 | ) | (125 | ) | 155 | ||||||||||||
| Other assets |
346 | 72 | (237 | ) | (245 | ) | (832 | ) | ||||||||||||
| Trade accounts payable and accrued liabilities |
(1,487 | ) | 3,426 | 2,721 | (1,542 | ) | 8,237 | |||||||||||||
| Deferred rent payable |
661 | 468 | 395 | 521 | 488 | |||||||||||||||
| Net cash provided by operating activities |
8,184 | 25,762 | 29,114 | 18,151 | 31,597 | |||||||||||||||
| Cash Flows From Investing Activities: |
||||||||||||||||||||
| Proceeds from sales of real estate, property and equipment |
1,210 | 2,648 | 921 | 33 | 84 | |||||||||||||||
| Purchases of property and equipment |
(20,197 | ) | (18,675 | ) | (39,649 | ) | (30,283 | ) | (43,158 | ) | ||||||||||
| Acquisition of Western Franchise Development, net of cash acquired |
— | — | (6,296 | ) | (6,263 | ) | — | |||||||||||||
| Acquisition of the Snyder Group Company |
(1,573 | ) | (56 | ) | — | — | — | |||||||||||||
| Issuance of notes receivable – stockholder/officer |
(300 | ) | (300 | ) | — | — | — | |||||||||||||
| Net cash used in investing activities |
(20,860 | ) | (16,383 | ) | (45,024 | ) | (36,513 | ) | (43,074 | ) | ||||||||||
| Cash Flows From Financing Activities: |
||||||||||||||||||||
| Borrowings of long-term debt |
53,133 | 6,377 | 18,769 | 18,030 | 33,294 | |||||||||||||||
| Payments of long-term debt and capital leases |
(48,007 | ) | (4,702 | ) | (58,876 | ) | (56,255 | ) | (23,331 | ) | ||||||||||
| Debt issuance costs |
(2,053 | ) | (460 | ) | (1,529 | ) | (1,455 | ) | (756 | ) | ||||||||||
| Repayment of debentures |
(9,160 | ) | — | — | — | — | ||||||||||||||
| Repayment of promissory notes |
(1,800 | ) | — | — | — | 79 | ||||||||||||||
| Sale of common stock to Quad C, a related party |
23,040 | — | — | — | — | |||||||||||||||
| Proceeds from sale of common stock, net |
664 | 81 | 42,797 | 42,732 | — | |||||||||||||||
| Proceeds from exercise of stock options |
— | — | 554 | 514 | 616 | |||||||||||||||
| Net cash provided by financing activities |
15,817 | 1,296 | 1,715 | 3,566 | 9,902 | |||||||||||||||
| Net (decrease) increase in cash and cash equivalents |
3,141 | 10,675 | (14,195 | ) | (14,796 | ) | (1,575 | ) | ||||||||||||
| Cash and cash equivalents, beginning of period |
5,176 | 8,317 | 18,992 | 18,992 | 4,797 | |||||||||||||||
| Cash and cash equivalents, end of period |
$ | 8,317 | $ | 18,992 | $ | 4,797 | $ | 4,196 | $ | 3,222 | ||||||||||
See Notes to Consolidated Financial Statements.
F-6
RED ROBIN GOURMET BURGERS, INC.
NOTES TO CONSOLIDATED FINANCIAL STATEMENTS
1. Description of the Business and Summary of Significant Accounting Policies
Red Robin Gourmet Burgers, Inc. (Red Robin or the Company), which was formed as a Delaware corporation in 2001, became the parent of Red Robin International, Inc. (RRI), a Nevada corporation, through a series of corporate transactions in 2001. Red Robin had no operations prior to merging with RRI. Red Robin and its subsidiaries operate Red Robin® restaurants from facilities that are owned or leased. RRI also sells franchises and receives royalties from the operation of franchised Red Robin® restaurants. Red Robin also owns and lease to third parties certain land, buildings and equipment. As of December 29, 2002, there were 96 company-owned restaurants in 12 states, and 98 additional restaurants operating under franchise or license agreements in 17 states and Canada. As of October 5, 2003, there were 110 company-owned restaurants in 13 states, and 101 additional restaurants operating under franchise or license agreements in 18 states and Canada.
In July 2002, Red Robin completed an initial public offering of 5,038,000 shares of common stock, of which it sold 4,000,000 shares, at a price to the public of $12.00 per share. The remaining 1,038,000 shares were offered by selling stockholders. The Company received proceeds of $42.8 million from the initial public offering, net of $3.4 million of underwriting fees and commissions and $1.8 million of other offering costs which were charged directly to additional paid-in capital as a reduction of the related proceeds. On August 16, 2002, the Company’s underwriters exercised their over-allotment option with respect to 400,000 additional shares offered by selling stockholders. The Company received no proceeds from the over-allotment exercise.
Principles of Consolidation — The consolidated financial statements of the Company include the accounts of Red Robin and its wholly owned subsidiaries after elimination of all material intercompany accounts and transactions.
Fiscal Year — The Company’s fiscal year ends on the last Sunday in December. The Company’s fiscal years ended December 31, 2000, December 30, 2001 and December 29, 2002 covered 53, 52 and 52 weeks, respectively. For the purposes of the accompanying consolidated financial statements, the periods ended December 31, 2000, December 30, 2001 and December 29, 2002 are referred to as the fiscal years 2000, 2001 and 2002, respectively. The Company’s first quarters include 16 weeks and the second and third quarters each included 12 weeks. Together, the first, second and third quarter of each respective period presented are referred to as the forty weeks ended October 6, 2002 and October 5, 2003, respectively. The interim financial statements of the Company for the forty weeks ended October 6, 2002 and October 5, 2003 are unaudited, but in the opinion of management, include all adjustments, consisting only of normal recurring items, necessary for a fair presentation of the financial position and results of operations for the interim periods. The interim results for the forty weeks ended October 5, 2003 are not necessarily indicative of the results that may be achieved in the future.
Use of Estimates — The preparation of financial statements in conformity with accounting principles generally accepted in the United States of America requires management to make estimates and assumptions that affect the reported amounts of assets and liabilities and disclosure of contingent assets and liabilities at the date of the financial statements and the reported amounts of revenues and expenses during the reporting periods. Some of the more significant estimates included in the preparation of the financial statements pertain to allowances for doubtful accounts, valuation of long-lived assets, fixed asset lives, impairment of goodwill and other intangible assets, income taxes, self-insurance and workers’ compensation reserves and closed restaurant reserves. Actual results could differ from those estimates.
Revenue Recognition — The Company typically grants franchise rights to private operators for a term of 20 years, with the right to extend the term for an additional ten years if conditions are satisfied. The Company provides management expertise, training, pre-opening assistance and restaurant operating assistance in exchange
F-7
RED ROBIN GOURMET BURGERS, INC.
NOTES TO CONSOLIDATED FINANCIAL STATEMENTS — (Continued)
for area development fees, franchise fees, license fees and royalties of 3% to 4% of the franchised restaurant’s adjusted sales. Franchise fee revenue from individual sales are recognized when all material obligations of and initial services to be provided by the Company have been performed, generally upon the opening of the restaurant. Until earned, these fees are accounted for as deferred revenue. Deferred revenue totaled $528,530 and $880,000 as of December 30, 2001 and December 29, 2002, respectively. Area franchise fees are dependent upon the number of restaurants in the territory as are the Company’s obligations under the area franchise agreement. Consequently, as the Company’s obligations are met, area franchise fees are recognized proportionately with the opening of each new restaurant. Royalties are accrued as earned, and are calculated each period based on the reporting franchisee’s adjusted sales.
Cash Equivalents — For purposes of the statement of cash flows, the Company considers all highly liquid instruments purchased with a maturity of three months or less to be cash equivalents.
Restricted Current Assets-Marketing Funds — Current assets restricted solely for use by the Company’s two marketing fund programs have been segregated from the Company’s assets. Certain franchisees and Company restaurants contribute between 0.3% and 0.5% of adjusted sales to each marketing fund to be used for future advertising in accordance with the terms of each program. A liability related to the restricted current assets is recorded when the funds are received.
Inventories — Inventories consist of food, beverages and supplies and are valued at the lower of cost (first-in, first-out method) or market.
Real Estate Held for Sale — Real estate held for sale is recorded at cost, not to exceed net realizable value. Determination of the lower of cost or net realizable value involves subjective judgment, because the actual market value of property can only be determined by negotiation between the parties in a sale transaction. The ultimate recoverability and valuation of these assets is dependent on future events, and the ability to successfully sell these properties is heavily influenced by economic conditions affected by the real estate industry. As of December 30, 2001 and December 29, 2002, one property is listed as held for sale. The Company is actively seeking a buyer for this property and expects that a sale will occur within one year. There were no sales of real estate held for sale in 2000. During 2001, real estate with a carrying value of $2,854,079 was sold resulting in a loss of $4,079. During 2002, real estate with a carrying value of $1,050,000 (see Note 7) was sold resulting in a loss of $162,736, including a $150,000 impairment of property held for sale which was recorded to adjust the property’s carrying value prior to its sale.
Property and Equipment — Property and equipment are recorded at cost. Expenditures for major additions and improvements are capitalized, and minor replacements, maintenance and repairs are charged to expense as incurred. Depreciation is computed on the straight-line method for financial reporting purposes, based on the shorter of the estimated useful lives or the terms of the underlying leases of the related assets. The Company uses other depreciation methods (generally accelerated) for tax purposes where appropriate. The Company capitalizes interest incurred on funds used to construct property and equipment. Capitalized interest is recorded as part of the asset to which it relates and is amortized over the asset’s estimated useful life. Interest capitalized totaled $327,494 in 2000, $173,759 in 2001 and $167,495 in 2002.
Debt Issuance Costs — Direct costs incurred for the issuance of debt are capitalized by the Company and amortized using the interest method over the term of the debt. Debt issuance costs and accumulated amortization as of December 30, 2001 were $2,914,309 and 368,695, respectively, and as of December 29, 2002 were $1,586,213 and $318,782, respectively.
F-8
RED ROBIN GOURMET BURGERS, INC.
NOTES TO CONSOLIDATED FINANCIAL STATEMENTS — (Continued)
Goodwill and Intangible Assets — Beginning with the adoption of Statement of Financial Accounting Standards No. 142 in 2002, the price paid over the net fair value of the tangible net assets of acquired businesses (goodwill) is no longer amortized. Prior to 2002, goodwill was amortized over its estimated useful life of 30 years. Franchise rights are amortized over their estimated useful life of 20 years, using the straight-line method. Liquor licenses are amortized over their respective useful lives, generally ranging from one to five years. The recoverability of goodwill and other intangible assets is evaluated annually, at a minimum, or on an interim basis if events or circumstances indicate a possible inability to realize the carrying amount.
Valuation of Long-Lived Assets — Management assesses for impairment both those assets to be held and used and long-lived assets to be disposed of by sale whenever events or changes in circumstances indicate that the carrying amount may not be recoverable. The Company will recognize an impairment loss when the sum of undiscounted expected future cash flows is less than the carrying amount of such assets. The measurement for such an impairment loss is then based on the fair value of the asset as determined by discounted cash flows or appraisals, if available.
Deferred Rent Payable — Deferred rent payable represents rental expense, recorded on a straight-line basis, in excess of actual rental payments.
Pre-opening Costs — The Company expenses pre-opening costs as incurred.
Income Taxes — The Company recognizes deferred tax liabilities and assets for the future consequences of events that have been recognized in the consolidated financial statements or tax returns of the Company. In the event the future consequences of differences between financial reporting bases and tax bases of the assets and liabilities of the Company result in a deferred tax asset, an evaluation is made of the probability of being able to realize the future benefits indicated by such asset. A valuation allowance related to a deferred tax asset is recorded when it is more likely than not that some portion or all of the deferred tax asset will not be realized. Measurement of the deferred items is based on enacted tax laws.
Earnings Per Share — The Company presents both basic and diluted earnings per share (EPS) amounts. Basic EPS is calculated by dividing net income by the weighted-average number of common shares outstanding during the year. Diluted EPS amounts are based upon the weighted average number of common and common equivalent shares outstanding during the year. Common equivalent shares are excluded from the computation in periods in which they have an anti-dilutive effect. Diluted earnings per share reflects the potential dilution that could occur if holders of options exercised their holdings into common stock. The Company uses the treasury stock method to calculate the impact of outstanding stock options.
F-9
RED ROBIN GOURMET BURGERS, INC.
NOTES TO CONSOLIDATED FINANCIAL STATEMENTS — (Continued)
The computations for basic and diluted earnings per share are as follows (in thousands, expect per share data):
| Fiscal Year |
Forty Weeks Ended | ||||||||||||||
| 2000 |
2001 |
2002 |
October 6, 2002 |
October 5, 2003 | |||||||||||
| (unaudited) | |||||||||||||||
| Net income |
$ | 15,431 | $ | 7,724 | $ | 8,264 | $ | 5,597 | $ | 11,541 | |||||
| Basic weighted average shares outstanding |
7,444 | 10,085 | 12,278 | 11,461 | 15,092 | ||||||||||
| Dilutive effect of stock options |
— | 151 | 382 | 427 | 251 | ||||||||||
| Diluted weighted average shares outstanding |
7,444 | 10,236 | 12,660 | 11,888 | 15,343 | ||||||||||
| Earnings Per Share: |
|||||||||||||||
| Basic |
$ | 2.07 | $ | 0.77 | $ | 0.67 | $ | 0.49 | $ | 0.76 | |||||
| Diluted |
$ | 2.07 | $ | 0.75 | $ | 0.65 | $ | 0.47 | $ | 0.75 | |||||
Unvested shares issued upon early exercise, as described in Note 15, are not considered outstanding for purposes of computing basic net income per share because the employee is not entitled to the rewards of ownership. However, these unvested shares are included as potentially dilutive for purposes of calculating diluted net income per share. Unvested shares issued upon early exercise totaled 103,448 for fiscal year 2002 and 34,483 for the forty weeks ended October 5, 2003.
Fair Value of Financial Instruments — The following disclosure of the estimated fair value of financial instruments has been determined using available market information and appropriate valuation methodologies. The carrying amounts of cash and cash equivalents, accounts receivables and accounts payable approximate fair values due to the short-term maturities of these instruments. The fair value of the Company’s revolving credit facility approximates its carrying amount, as the facility’s interest rates approximate market rates. The fair values of the Company’s debt has been estimated using discounted cash flow analyses based on market rates obtained from independent third parties for similar type debt. The carrying amounts and related estimated fair values for the Company’s debt is as follows (in thousands):
| 2001 |
2002 | |||||||||||
| Carrying Amount |
Fair Value |
Carrying Amount |
Fair Value | |||||||||
| Term loan |
$ | 47,303 | $ | 48,097 | $ | — | $ | — | ||||
| Wachovia revolving credit facility |
— | — | 11,000 | 11,000 | ||||||||
| Collateralized notes and capital leases |
$ | 32,784 | $ | 37,073 | $ | 28,980 | $ | 34,185 | ||||
Derivatives — The Company follows SFAS No. 133, Accounting for Derivative Instruments and Hedging Activities. SFAS No. 133, as amended, requires derivative instruments to be recorded in the balance sheet at their fair value with changes in fair value being recognized in earnings unless specific hedge accounting criteria are met.
Employee Stock Compensation Plans — The Company follows Accounting Principles Board Opinion (APB) No. 25, Accounting for Stock Issued to Employees, in its accounting for stock based compensation to employees whereby any intrinsic value as determined on the measurement date results in compensation. Accordingly, pre-tax compensation expense of $79,568 and $59,676 was recognized during fiscal 2002 and the forty weeks ended October 5, 2003, respectively, for certain options granted during 2002 with intrinsic value on the date of grant. No compensation expense is recognized in the Company’s financial statements for employee stock options
F-10
RED ROBIN GOURMET BURGERS, INC.
NOTES TO CONSOLIDATED FINANCIAL STATEMENTS — (Continued)
granted at a price equal to, or greater than the market price of the Company’s common stock on the date of grant. If under SFAS No. 123, Accounting for Stock Based Compensation, the Company determined compensation costs based on the fair value at the date of grant for its stock options, net income and earnings per share would have been reduced to the following pro forma amounts (in thousands, except per share data):
| Fiscal Year Ended |
Forty Weeks Ended | ||||||||||||||
| 2000 |
2001 |
2002 |
October 6, 2002 |
October 5, 2003 | |||||||||||
| (unaudited) | |||||||||||||||
| Net Income, as reported |
$ | 15,431 | $ | 7,724 | $ | 8,264 | $ | 5,597 | $ | 11,541 | |||||
| Add: Stock-based employee compensation costs expense included in reported net income, net of related tax benefit |
— | — | 50 | 37 | 37 | ||||||||||
| Deduct: Stock-based employee compensation costs, net of tax benefit |
487 | 616 | 524 | 449 | 755 | ||||||||||
| Pro forma net income |
$ | 14,944 | $ | 7,108 | $ | 7,790 | $ | 5,185 | $ | 10,823 | |||||
| Basic Earnings Per Share: |
|||||||||||||||
| As reported |
$ | 2.07 | $ | 0.77 | $ | 0.67 | $ | 0.49 | $ | 0.76 | |||||
| Pro forma |
$ | 2.01 | $ | 0.70 | $ | 0.63 | $ | 0.45 | $ | 0.72 | |||||
| Diluted Earnings Per Share: |
|||||||||||||||
| As reported |
$ | 2.07 | $ | 0.75 | $ | 0.65 | $ | 0.47 | $ | 0.75 | |||||
| Pro forma |
$ | 2.01 | $ | 0.69 | $ | 0.62 | $ | 0.44 | $ | 0.71 | |||||
The weighted average fair values of options at their grant date during 2000, 2001 and 2002, where the exercise price equaled the market price on the grant data, were $2.58, $2.52 and $6.10, respectively. The estimated fair value of each option granted is calculated using the Black-Scholes multiple option-pricing model. The assumptions used in the model were as follows:
| Fiscal Year Ended |
Forty Weeks Ended |
||||||||||||||
| 2000 |
2001 |
2002 |
October 6, 2002 |
October 5, 2003 |
|||||||||||
| Risk-free interest rate |
6.0 | % | 5.0 | % | 4.3 | % | 4.3 | % | 3.1 | % | |||||
| Expected years until exercise |
10 | 10 | 5.5 | 5.5 | 5.5 | ||||||||||
| Expected stock volatility |
N/A | N/A | 56.1 | % | 56.1 | % | 48.5 | % | |||||||
| Dividend yield |
0.0 | % | 0.0 | % | 0.0 | % | 0.0 | % | 0.0 | % | |||||
Concentration of Risk — Financial instruments which potentially subject the Company to concentrations of credit risk are cash equivalents and accounts receivable. The Company attempts to limit its credit risk associated with cash equivalents by placing the Company’s financial instruments with major financial institutions. The Company’s trade accounts receivable are comprised principally of amounts due from its franchisees and landlords. With respect to accounts receivable, the Company limits its credit risk by performing ongoing credit evaluations and, when deemed necessary, requiring letters of credit, guarantees or collateral. Management does not believe significant risk exists in connection with the Company’s concentrations of credit at December 29, 2002.
F-11
RED ROBIN GOURMET BURGERS, INC.
NOTES TO CONSOLIDATED FINANCIAL STATEMENTS — (Continued)
Comprehensive Income — Comprehensive income consists of the net income and other gains and losses affecting stockholders’ equity that, under accounting principles generally accepted in the United States, are excluded from net income. For the Company, other comprehensive loss consists of the unrealized loss related to the interest rate swap agreement.
Reclassifications — Certain amounts in the 2000, 2001 and 2002 consolidated financial statements have been reclassified to conform to the 2003 presentation.
2. Recent Accounting Pronouncements
In July 2001, the Financial Accounting Standards Board (FASB) issued Statement of Financial Accounting Standards (SFAS) No. 141, Business Combinations, and SFAS No. 142, Goodwill and Other Intangible Assets. SFAS No. 141 requires the purchase method of accounting for business combinations initiated after June 30, 2001, eliminates the pooling-of-interests method and modifies the criteria for recognition of intangible assets. SFAS No. 142 addresses the financial accounting and reporting for acquired goodwill and other intangible assets. Under the provisions of SFAS No. 142, goodwill and certain indefinite-lived intangible assets are no longer subject to amortization over their estimated useful life. Instead, impairment is assessed on an annual basis, or more frequently if circumstances indicate a possible impairment, by means of a fair-value based test.
Effective at the beginning of fiscal year 2002, the Company adopted SFAS No. 142, and, in accordance with its provisions, reclassified the carrying amount of assembled workforce intangible assets to goodwill. The following table presents changes in the carrying amount of goodwill for the year ended December 29, 2002 (in thousands):
| Balance as of December 30, 2001 |
$ | 22,555 | |
| Reclassification of assembled workforce from other intangibles, net of related deferred tax liability of $473 |
694 | ||
| Goodwill acquired during the year |
2,471 | ||
| Balance as of December 29, 2002 |
$ | 25,720 | |
F-12
RED ROBIN GOURMET BURGERS, INC.
NOTES TO CONSOLIDATED FINANCIAL STATEMENTS — (Continued)
In accordance with the provisions of SFAS No. 142, the Company ceased amortizing goodwill as of the beginning of fiscal year 2002. The following table presents the impact of SFAS No. 142 on net income and net income per share as if the standard had been in effect for 2000, 2001 and 2002 (in thousands, except per share data):
| 2000 |
2001 |
2002 | |||||||
| Reported net income |
$ | 15,431 | $ | 7,724 | $ | 8,264 | |||
| Add back: Amortization of goodwill |
485 | 794 | — | ||||||
| Add back: Amortization of assembled workforce intangible assets, net of tax benefit |
519 | 569 | — | ||||||
| Adjusted net income |
$ | 16,435 | $ | 9,087 | $ | 8,264 | |||
| Basic net income per share: |
|||||||||
| Reported basic net income per share |
$ | 2.07 | $ | 0.77 | $ | 0.67 | |||
| Amortization of goodwill |
0.07 | 0.08 | — | ||||||
| Amortization of assembled workforce intangible assets, net of tax benefit |
0.07 | 0.06 | — | ||||||
| Adjusted basic net income per share |
$ | 2.21 | $ | 0.91 | $ | 0.67 | |||
| Diluted earnings per share: |
|||||||||
| Reported diluted net income per share |
$ | 2.07 | $ | 0.75 | $ | 0.65 | |||
| Amortization of goodwill |
0.07 | 0.08 | — | ||||||
| Amortization of assembled workforce intangible assets, net of tax benefit |
0.07 | 0.06 | — | ||||||
| Adjusted diluted net income per share |
$ | 2.21 | $ | 0.89 | $ | 0.65 | |||
The following table presents intangible assets subject to amortization as of December 30, 2001 and December 29, 2002 (in thousands):
| 2001 |
2002 |
|||||||||||||
| Gross Carrying Amount |
Accumulated Amortization |
Gross Carrying Amount |
Accumulated Amortization |
|||||||||||
| Intangible assets subject to amortization |
||||||||||||||
| Franchise rights |
$ | 5,800 | $ | (409 | ) | $ | 8,600 | $ | (828 | ) | ||||
| Assembled workforce |
2,530 | (1,362 | ) | — | — | |||||||||
| Liquor licenses |
920 | (445 | ) | 1,236 | (654 | ) | ||||||||
| $ | 9,250 | $ | (2,216 | ) | $ | 9,836 | $ | (1,482 | ) | |||||
The following table presents aggregate amortization expense for 2002, and estimated aggregate amortization expense related to intangible assets subject to amortization for each of the five succeeding fiscal years (in thousands):
| Aggregate amortization expense |
|||
| For the year ended December 29, 2002 |
$ | 629 | |
| Estimated amortization expense |
|||
| For the year ending 12/29/03 |
611 | ||
| For the year ending 12/28/04 |
575 | ||
| For the year ending 12/26/05 |
555 | ||
| For the year ending 12/25/06 |
512 | ||
| For the year ending 12/31/07 |
449 |
F-13
RED ROBIN GOURMET BURGERS, INC.
NOTES TO CONSOLIDATED FINANCIAL STATEMENTS — (Continued)
In August 2001, the FASB issued SFAS No. 144, Accounting for the Impairment or Disposal of Long-Lived Assets. SFAS No. 144 provides new guidance on the recognition of impairment losses on long-lived assets to be held and used or to be disposed of and also broadens the definition of what constitutes a discontinued operation and how the results of a discontinued operation are to be measured and presented. SFAS No. 144 superseded SFAS No. 121, Accounting for the Impairment of Long-Lived Assets and Long-Lived Assets to Be Disposed Of, and APB Opinion No. 30, Reporting the Results of Operations – Reporting the Effects of Disposal of a Segment of a Business, and Extraordinary, Unusual and Infrequently Occurring Events and Transactions. The provisions of SFAS No. 144 are effective in fiscal years beginning after December 15, 2001, and in general are to be applied prospectively. The Company’s adoption of SFAS No. 144, effective at the beginning of fiscal year 2002, did not have a material impact on its results of operations and financial position.
In April 2002, the FASB issued SFAS No. 145, Rescission of FASB Statements No. 4, 44 and 64, Amendment of FASB Statement No. 13, and Technical Corrections. Under SFAS No. 145, gains and losses from extinguishment of debt shall be classified as extraordinary items only if they meet certain criteria for classification as extraordinary items in APB Opinion No. 30. SFAS No. 145 also amends SFAS No. 13, Accounting for Leases, to require sale-leaseback accounting for certain lease modifications that have economic effects that are similar to sale-leaseback transactions and also makes various technical corrections to existing pronouncements that are not substantive in nature. The provisions of SFAS No. 145 related to the rescission of SFAS No. 4 are effective in fiscal years beginning after May 15, 2002, with early application encouraged. The provisions of SFAS No. 145 related to SFAS No. 13 are effective for transactions occurring after May 15, 2002, with early application encouraged. All other provisions of SFAS No. 145 are effective for financial statements issued on or after May 15, 2002, with early application encouraged. The Company early adopted SFAS No. 145 in the second quarter of fiscal year 2002 and consequently did not record the loss on debt extinguishment, as described in Note 9, as an extraordinary item.
In May 2002, the FASB issued SFAS No. 146, Accounting for Costs Associated with Exit or Disposal Activities. SFAS No. 146 addresses financial accounting and reporting for costs associated with exit or disposal activities and nullifies Emerging Issues Task Force (EITF) Issue No. 94-3, Liability Recognition for Certain Employee Termination Benefits and Other Costs to Exit an Activity (including certain Costs Incurred in a Restructuring). SFAS No. 146 requires that a liability for an exit cost or disposal activity be recognized when the liability is incurred, whereas under EITF No. 94-3, a liability was recognized at the date of an entity’s commitment to an exit plan. SFAS No. 146 also establishes that fair value is the objective for initial measurement of the liability. The provisions of SFAS No. 146 are effective for exit or disposal activities that are initiated after December 31, 2002, with early application encouraged. Adoption of SFAS No. 146 did not have an impact on our financial statements for the forty weeks ended October 5, 2003, because Company has not had any exit of disposal activities that would be subject to the provisions of SFAS 146.
In November 2002, the FASB issued Interpretation No. 45 (FIN 45), Guarantor’s Accounting and Disclosure Requirements for Guarantees, Including Indirect Guarantees of Indebtedness of Others. FIN 45 elaborates on the existing disclosure requirements for most guarantees. It also clarifies that at the time a company issues a guarantee, it must recognize an initial liability for the fair value of the obligations it assumes under that guarantee and must disclose that information in its interim and annual financial statements. The accounting provisions of FIN 45 are effective on a prospective basis to guarantees issued or modified after December 15, 2002. The disclosure requirements of FIN 45 are effective for financial statements for periods ending after December 15, 2002. As of December 29, 2002. The Company does not have material guarantees that require disclosure under FIN 45 and adoption of its initial recognition and initial measurement provisions is not expected to have a material impact on the Company’s consolidated financial position or results of operations.
F-14
RED ROBIN GOURMET BURGERS, INC.
NOTES TO CONSOLIDATED FINANCIAL STATEMENTS — (Continued)
In December 2002, the FASB issued SFAS No. 148, Accounting for Stock-Based Compensation — Transition and Disclosure. SFAS No. 148 amends FASB Statement No. 123, Accounting for Stock-Based Compensation, to provide alternative methods of transition for a voluntary change to the fair value based method of accounting for stock-based compensation. In addition, SFAS No. 148 amended the disclosure requirements of SFAS No. 123 to require prominent disclosures in both annual and interim financial statements about the method of accounting for stock-based employee compensation and the effect of the method used on reported results. SFAS No. 148 became effective for fiscal years ending after December 15, 2002. The Company has adopted the disclosure related provisions of SFAS No. 148, and has chosen to continue to report stock based compensation for employees under APB Opinion No. 25, whereby any intrinsic value as determined on the measurement date results in compensation.
In January 2003, the Emerging Issues Task Force (EITF) reached a final consensus on EITF Issue No. 02-16, Accounting by a Customer (Including a Reseller) for Certain Consideration Received from a Vendor. EITF No. 02-16 clarifies certain aspects for accounting and recording by customers of consideration received from suppliers. Under EITF No. 02-16, consideration received related to growth rebates and agreements containing specified time period restrictions should be recorded as a reduction of cost of goods sold and recognized on a systematic and rational allocation if the amounts are probable and reasonably estimable. In addition, consideration received for certain promotional activities should be recorded as a reduction of those costs, with any excess being recorded as a reduction of cost of goods sold. The adoption of EITF No. 02-16 did not have an impact on the Company’s consolidated financial position or results of operations.
In January 2003, the Financial Accounting Standards Board (FASB) issued Interpretation No. 46, Consolidation of Variable Interest Entities (FIN 46), which requires the consolidation of certain special purpose or variable interest entities. FIN 46 is applicable to financial statements issued after 2002. The Company has no variable interest in variable interest entities and, therefore, there are no entities that require consolidation in the Company’s financial statements as a result of FIN 46.
3. Franchise Acquisitions
On January 14, 2002, a wholly owned subsidiary of Red Robin acquired all of the outstanding stock of Western Franchise Development, Inc. (WFD) for $6.3 million in cash, net of $148,691 of cash acquired. WFD operated six restaurants in Northern California under franchise agreements with the Company. The Company acquired WFD after exercising its right of first refusal upon reviewing an offer between the franchisee and a third party. The final purchase price was equal to the amount agreed upon between the franchisee and the third party. WFD’s results of operations have been included in the accompanying consolidated statements of income from its date of acquisition. The Company accounted for the transaction as a purchase business combination and the purchase price has been allocated to the assets acquired and liabilities assumed based on their fair values at the date of acquisition as follows (in thousands):
| Current assets |
$ | 251 | ||
| Property and equipment |
1,736 | |||
| Goodwill |
2,471 | |||
| Intangible assets subject to amortization |
2,903 | |||
| Current liabilities |
(1,065 | ) | ||
| Cash paid for acquisition of WFD, net of cash acquired |
$ | 6,296 | ||
Intangible assets subject to amortization include franchise rights of $2.8 million and liquor licenses of $102,558.
F-15
RED ROBIN GOURMET BURGERS, INC.
NOTES TO CONSOLIDATED FINANCIAL STATEMENTS — (Continued)
On January 28, 2002, the Company acquired the assets of two restaurants in Missouri and Ohio for $2.8 million in cash from a franchisee. On February 11, 2002, the Company assumed operation of a second restaurant in Ohio, which had been subleased by the Company to this franchisee. On February 19, 2002, the Company consummated the purchase of the assets of a third restaurant in Ohio from this same franchisee for approximately $1.0 million in cash. The results of operations for each of these restaurants have been included in the accompanying Consolidated Statements of Income from their respective date of acquisition.
On May 11, 2000, the Company acquired all of the outstanding stock of The Snyder Group Company (SGC), an entity controlled by Mike Snyder, an officer and stockholder of the Company, and partially owned by Mike Woods and Bob Merullo, officers of the Company, in exchange for approximately $9.2 million in debentures, approximately $1.8 million in promissory notes, and 1,889,708 shares of the Company’s common stock, valued at $5.80 per share. The purchase price, which included deal costs of approximately $1.6 million, was subject to adjustment based upon SGC’s net worth as of the date of closing, as defined. On May 10, 2001, the purchase price was adjusted by $112,048 through the issuance of 9,659 additional shares of the Company’s common stock and payment of $56,024. SGC operated 14 restaurants in the states of Colorado and Washington under franchise agreements with the Company. The Company accounted for the transaction as a purchase business combination, and SGC’s results of operations have been included in the accompanying consolidated statements of income from its date of acquisition. The purchase price has been allocated to assets acquired and liabilities assumed based on their fair values at the date of acquisition, as follows (in thousands):
| Current assets |
$ | 735 | ||
| Property and equipment |
10,565 | |||
| Goodwill and intangible assets |
32,221 | |||
| Other assets |
216 | |||
| Liabilities assumed, including long-term debt |
(20,035 | ) | ||
| Total |
$ | 23,702 | ||
The debentures accrued interest at 10.0% until being repaid in September 2000 in connection with the receipt of proceeds from the Finova term loan described in Note 9. The promissory notes also accrued interest at 10.0% and were repaid when the Company received proceeds from the Finova term loan described in Note 9. In connection with the acquisition, 862,069 shares of the Company’s common stock issued to SGC’s stockholders were placed in escrow to satisfy any adjustments to the purchase price and any claims of indemnity. Forty percent of the escrowed shares were released as of December 30, 2001. Fifty percent of the balance were released two years after the closing on May 11, 2002. The remaining balance was released as of the date of closing of the Company’s initial public offering of common stock on July 24, 2002. The release of shares by the escrow agent occurred without any claims of indemnity.
The following unaudited pro forma data summarizes the results of operations as if the acquisition of SGC had been completed at the beginning of fiscal year 2000. The pro forma data gives effect to actual operating results prior the acquisition, adjusted to include the estimated pro forma effect of royalties, interest expense, amortization of intangibles and income taxes. These pro forma amounts do not purport to be indicative of the results that would have actually been obtained if the acquisition occurred as of the beginning of the year presented or that may be obtained in the future (in thousands, except per share data).
| 2000 | |||
| Total revenues |
$ | 204,838 | |
| Net income |
14,184 | ||
| Earnings Per Share: |
|||
| Basic |
$ | 1.91 | |
| Diluted |
$ | 1.91 | |
F-16
RED ROBIN GOURMET BURGERS, INC.
NOTES TO CONSOLIDATED FINANCIAL STATEMENTS — (Continued)
4. Accounts Receivable
Accounts receivable consists of the following at (in thousands):
| 2001 |
2002 |
|||||||
| Trade receivable due from franchisees |
$ | 2,499 | $ | 1,043 | ||||
| Receivable from landlords |
1,531 | 209 | ||||||
| Note receivable — current |
— | 73 | ||||||
| Other |
232 | 529 | ||||||
| 4,262 | 1,854 | |||||||
| Allowance for doubtful accounts |
(1,565 | ) | (212 | ) | ||||
| Accounts receivable, net |
$ | 2,697 | $ | 1,642 | ||||
Activity in the allowance for doubtful accounts is as follows (in thousands):
| 2000 |
2001 |
2002 |
||||||||||
| Allowance for doubtful accounts, beginning of period |
$ | 335 | $ | 1,608 | $ | 1,565 | ||||||
| Additions |
1,337 | 725 | 119 | |||||||||
| Decreases |
(64 | ) | (768 | ) | (1,472 | ) | ||||||
| Allowance for doubtful accounts, end of period |
$ | 1,608 | $ | 1,565 | $ | 212 | ||||||
5. Restricted Current Assets — Marketing Funds
Marketing funds consist of the following at (in thousands):
| 2001 |
2002 | |||||
| Cash |
$ | 162 | $ | 243 | ||
| Prepaid assets |
282 | 238 | ||||
| Inventory |
6 | — | ||||
| Accounts receivable from franchisees |
231 | 136 | ||||
| Restricted current assets — marketing funds |
$ | 681 | $ | 617 | ||
6. Property and Equipment
Property and equipment consists of the following at (in thousands):
| Estimated Lives |
2001 |
2002 |
||||||||
| Land |
$ | 6,881 | $ | 11,623 | ||||||
| Buildings |
15 to 30 years | 6,373 | 13,197 | |||||||
| Furniture, fixtures and equipment |
3 to 7 years | 46,104 | 56,715 | |||||||
| Leasehold improvements |
Shorter of lease term or life | 64,844 | 80,662 | |||||||
| Restaurant property leased to others |
3 to 30 years | 8,785 | 6,675 | |||||||
| Construction in progress |
4,451 | 6,222 | ||||||||
| 137,438 | 175,094 | |||||||||
| Accumulated depreciation and amortization |
(54,987 | ) | (64,918 | ) | ||||||
| Property and equipment, net |
$ | 82,451 | $ | 110,176 | ||||||
F-17
RED ROBIN GOURMET BURGERS, INC.
NOTES TO CONSOLIDATED FINANCIAL STATEMENTS — (Continued)
Depreciation and amortization expense on fixed assets, including assets under capital lease, was $6,931,133 in 2000, $8,403,369 in 2001 and $12,254,156 in 2002.
Based upon management’s assessment of long-lived assets, the Company determined that the carrying amounts of certain of its long-lived assets were not recoverable. The restaurants identified in management’s assessment had experienced losses from operations and cash flow. The fair value of the assets to be held and used in continuing operations for which an impairment was recorded was estimated using the present value of estimated expected future cash flows in order to determine the amount of impairment loss. Impairment costs recognized during 2000, 2001 and 2002 were $1,132,237, $0 and $1,132,814, respectively. There were no restaurants held for disposal as of December 30, 2001 or December 29, 2002.
7. Other Assets
Other assets consist of the following (in thousands):
| 2001 |
2002 | |||||
| Loan fees |
$ | 2,546 | $ | 1,267 | ||
| Note receivable |
1,050 | — | ||||
| Deposits |
252 | 398 | ||||
| Other |
177 | 54 | ||||
| $ | 4,025 | $ | 1,719 | |||
The note receivable resulted from the sale of certain property, and was to be paid over five years with monthly payments of $11,545 and a balloon payment due August 2005. Interest was fixed at 10.75%. The note was collateralized by the property sold. In July 2001, the debtor ceased making payments due to financial difficulties and, in February 2002, the property was reacquired in settlement of the note. A loss of $140,851 was recorded in 2001 for the write-down of the note to the fair value of the property. The property was subsequently sold in 2002, resulting in a loss of $162,736.
8. Closed Restaurant Reserve
Prior to adoption of SFAS No. 146 in fiscal 2003, the Company recorded a reserve when a decision was made to close a restaurant. Reserves principally consisted of real estate brokerage costs for sales of owned property, lease termination fees and lease commitments post closing up to the date of sublease for leased properties. Activity in the closed restaurant reserves account is as follows (in thousands):
| 2000 |
2001 |
2002 |
||||||||||
| Closed restaurant reserves, beginning of period |
$ | 672 | $ | 354 | $ | 215 | ||||||
| Additions |
170 | 37 | — | |||||||||
| Decreases |
(488 | ) | (176 | ) | (215 | ) | ||||||
| Closed restaurant reserves, end of period |
$ | 354 | $ | 215 | $ | — | ||||||
F-18
RED ROBIN GOURMET BURGERS, INC.
NOTES TO CONSOLIDATED FINANCIAL STATEMENTS — (Continued)
9. Borrowings
The Company’s borrowings are summarized below (in thousands):
| 2001 |
2002 |
October 5, 2003 |
||||||||||
| (unaudited) | ||||||||||||
| Wachovia revolving credit facility |
$ | — | $ | 11,000 | $ | 33,686 | ||||||
| Finova term loan |
47,303 | — | — | |||||||||
| Capital leases (Note 13) |
13,252 | 13,120 | 6,302 | |||||||||
| Collateralized notes payable |
19,533 | 15,860 | 11,555 | |||||||||
| 80,088 | 39,980 | 51,543 | ||||||||||
| Current portion |
(5,078 | ) | (1,828 | ) | (1,359 | ) | ||||||
| Long-term debt |
$ | 75,010 | $ | 38,152 | $ | 50,184 | ||||||
On July 24, 2002, the Company entered into a three-year, $40.0 million revolving credit agreement with Wachovia Bank, N.A. (Wachovia) and other financial institutions named therein. The facility expires on July 24, 2005 unless extended. The Wachovia facility is secured by a first priority pledge of all of the outstanding capital stock of the Company’s subsidiaries and a first priority lien on substantially all of the Company’s tangible and intangible assets. Borrowings under the Wachovia revolving credit facility bear interest at one of the following rates as selected by the Company: an Alternate Base Rate (ABR), which is based on the Prime Rate plus 0.5% to 1.25%; or a London Interbank Offered Rate (LIBOR), which is based on the relevant one, two, three or six month LIBOR at the Company’s discretion, plus 1.5% to 2.25%. The spread, or margin, for ABR and LIBOR loans is adjusted quarterly based on the Company’s then current leverage ratio. Interest payments on ABR loans are due the last day of each March, June, September and December and on the maturity date. Interest payments on LIBOR loans having an interest period of three months or less are due the last day of such interest period. Interest payments on LIBOR loans having an interest period longer than three months are due every three months after the first day of the interest period and the last day of such interest period. In addition, the Company may borrow up to $3.0 million from Wachovia under a loan subfacility (swingline) as long as the sum of the outstanding ABR and LIBOR loans, swingline loans and letters of credit do not exceed $40.0 million. Swingline loans bear interest at a per annum rate equal to the prime rate plus 0.5% to 1.25%. As of December 29, 2002, borrowings outstanding under the Wachovia revolving credit facility bear interest at approximately 3.6%.
The Wachovia agreement required the Company to exercise purchase options related to restaurant property and assets under capital lease in Highlands Ranch, Colorado, Issaquah, Washington and Grapevine, Texas. The exercise of the Highlands Ranch purchase option was completed in January 2003 for $4.0 million, the exercise of the Issaquah purchase option was completed in August 2003 for $3.7 million, and the exercise of the Grapevine purchase option was completed in September 2003 for $3.5 million. The exercise of each of these purchase options was funded with borrowings from our revolving credit facility, which further reduced the amount of borrowings available under the revolving credit facility. As a result of the exercise of these purchase options, the Company incurred legal fees and prepayment penalties, non-cash write-offs of unamortized debt issuance costs, and other costs totaling $150,300, which have been included in the Company’s financial statements under “loss on early extinguishment of debt.”
During June 2003, the Company elected to prepay $3.2 million of real estate and equipment loans using borrowings from its revolving credit facility. These loans were payable monthly over remaining terms ranging from three to eight years and were subject to fixed interest rates ranging from 7.9% to 9.7%. As a result of these prepayments, the Company incurred loan termination fees, non-cash write-offs of unamortized debt issuance
F-19
RED ROBIN GOURMET BURGERS, INC.
NOTES TO CONSOLIDATED FINANCIAL STATEMENTS — (Continued)
costs, and other costs totaling $106,500, which have been included in the Company’s financial statements under “loss on extinguishment of debt.”
The revolving credit facility is subject to a commitment fee of 0.5% per annum on the average daily unused portion of the revolver as defined per the agreement. In addition, the Company must pay a fee in consideration of letter of credit commitments equal to 1.5% to 2.25% on the average daily maximum amount available to be drawn under each letter of credit from the date of issuance to the date of expiration. The Company must also pay the reasonable and customary charges of Wachovia with respect to the amendment, transfer, administration, cancellation and conversion of, and drawings under, letters of credit. Commitment and letter of credit fees are payable quarterly, in arrears on the 15th day following the last day of each calendar quarter.
The revolving credit agreement requires that the Company comply with a maximum leverage ratio as well as a minimum fixed charge coverage ratio, and minimum earnings before interest, taxes, depreciation and amortization (EBITDA), requirements. In addition, the Company must comply with certain consolidated capital expenditure maximums and operating lease restrictions. The credit agreement restricts the Company’s ability to, among other things, engage in mergers, acquisitions, joint ventures and sale-leaseback transactions, and to sell assets, incur indebtedness, make investments, create liens and pay dividends. In 2002, the maximum consolidated capital expenditure covenant was not met, and the lenders have waived such noncompliance. As of December 29, 2002, the Company was in compliance with all other covenants.
At December 29, 2002, an irrevocable letter of credit totaling $841,000 has been issued under the Wachovia agreement. As of October 6, 2003, the letter of credit had been increased to $2,041,000. This letter is being maintained to back the Company’s self-insured workers’ compensation program and reduces the amount of borrowings available on our revolving credit facility. The letter is being maintained to back the Company’s self-insured workers’ compensation program.
On May 20, 2003, the Company amended its revolving credit facility (see Note 19).
In July 2002, the Company used proceeds from its initial public offering, as described in Note 1, together with borrowings under the Wachovia revolving credit facility, to repay: $48.0 million outstanding under the Company’s existing Finova term loan, including $0.3 million of accrued interest and a prepayment penalty of $1.8 million; $5.0 million outstanding under the Company’s revolving credit facility with U.S. Bank, N.A. (US Bank); $1.6 million outstanding under one real estate loan, including a 1% prepayment penalty; and $0.4 million outstanding under three equipment loans. Termination of the Company’s Finova term loan and U.S. Bank revolving credit facility also resulted in non-cash charges of $2.4 million during the third quarter of 2002 resulting from the write-off of capitalized debt issuance costs that were being amortized over the respective lives of the relevant credit agreements. The Company early adopted SFAS No. 145 in the second quarter of fiscal year 2002 and consequently did not record the loss on extinguishment of debt as an extraordinary item.
The Finova and U.S. Bank agreements were both terminated upon repayment and the Company has no remaining obligations under either of these agreements. The Finova agreement was consummated on September 6, 2000. The Finova term loan was payable in equal monthly installments of $593,790 with the final payment due September 1, 2012, and bore interest at 9.9%. The U.S. Bank agreement was consummated on April 25, 2002 and provided short term financing prior to the Company’s initial public offering. Prior to termination, amounts outstanding under the U.S. Bank revolving credit agreement bore interest at LIBOR plus 3.0%, payable monthly, in arrears.
The collateralized notes payable are secured by certain property and equipment of the Company. Under some of these agreements, the Company is required to maintain certain financial ratios. As of December 29,
F-20
RED ROBIN GOURMET BURGERS, INC.
NOTES TO CONSOLIDATED FINANCIAL STATEMENTS — (Continued)
2002, the Company is in compliance with all covenants for collateralized notes payable. The collateralized notes payable require monthly principle and interest payments through 2016, with a weighted average interest rate of 9.9% at December 29, 2002.
Maturities of long-term debt and capital lease obligations as of December 29, 2002 are as follows (in thousands):
| 2003 |
$ | 1,828 | |
| 2004 |
1,972 | ||
| 2005 |
14,736 | ||
| 2006 |
2,170 | ||
| 2007 |
2,338 | ||
| Thereafter |
16,936 | ||
| $ | 39,980 | ||
10. Supplemental Disclosures to Consolidated Statements of Cash Flows (in thousands)
| 2000 |
2001 |
2002 | |||||||
| Interest paid |
$ | 6,536 | $ | 7,806 | $ | 5,907 | |||
| Income taxes paid, net |
817 | 1,600 | 1,816 | ||||||
| Notes receivable from stockholders related to early exercise of stock options |
— | — | 5,400 | ||||||
| Note receivable from sale of property |
1,195 | — | — | ||||||
| Common stock issued for The Snyder Group Company acquisition |
10,960 | 56 | — | ||||||
| Common stock issued to a related party for debt retirement |
4,500 | — | — | ||||||
| Debentures and promissory note issued for The Snyder Group Company acquisition |
10,960 | — | — | ||||||
11. Derivative Instruments
The Company’s objective in managing exposure to interest rate changes is to limit the impact of interest rate changes on earnings and cash flows and to lower overall borrowing costs. To achieve this objective, the Company may use interest rate swaps and caps to manage its net exposure to interest rate changes related to our portfolio of borrowings.
The Company has adopted SFAS No. 133, Accounting for Derivative Instruments and Hedging Activities. SFAS No. 133, as amended, requires that all derivative instruments be recorded on the balance sheet at fair value. As appropriate, on the date derivative contracts are entered into, the Company designates the derivatives as either (i) a hedge of the fair value of a recognized asset or liability or of an unrecognized firm commitment (fair value hedge) or (ii) a hedge of a forecasted transaction or of the variability of cash flows to be received or paid related to a recognized asset or liability (cash flow hedge).
On December 11, 2002, the Company entered into a variable-to-fixed interest rate swap agreement with an effective date of January 29, 2003, which expires on January 30, 2006. The agreement has been designated as a cash flow hedge under which the Company will pay interest on $10.0 million of notional amount at a fixed rate and receive interest on $10.0 million of notional amount at a variable rate. The variable rate interest to be received by the Company will be based on 1-month LIBOR rate, initially determined two banking days prior to
F-21
RED ROBIN GOURMET BURGERS, INC.
NOTES TO CONSOLIDATED FINANCIAL STATEMENTS — (Continued)
the effective date. Thereafter, the interest rate will reset according to the then current 1-month LIBOR two days prior to the first day of each monthly calculation period.
This hedge is highly effective as defined by SFAS No. 133, and there were no gains or losses recognized in earnings during the reporting periods presented. As of December 29, 2002, the unrealized loss on derivative instruments designated and qualifying as cash flow hedging instruments that are reported in comprehensive income totaled $83,506, net of tax benefit of $49,678.
12. Income Taxes
The (provision) benefit for income taxes consists of the following (in thousands):
| 2000 |
2001 |
2002 |
||||||||||
| Current: |
||||||||||||
| Federal |
$ | (670 | ) | $ | (1,965 | ) | $ | (2,163 | ) | |||
| State |
(7 | ) | (533 | ) | (553 | ) | ||||||
| Deferred: |
||||||||||||
| Federal |
284 | (1,104 | ) | (1,086 | ) | |||||||
| State |
(184 | ) | (120 | ) | (279 | ) | ||||||
| (577 | ) | (3,722 | ) | (4,081 | ) | |||||||
| Changes in valuation allowance |
13,134 | — | — | |||||||||
| $ | 12,557 | $ | (3,722 | ) | $ | (4,081 | ) | |||||
During the year ended December 31, 2000, the Company realized benefits for the use of approximately $2.6 million of regular federal tax operating losses. During the period ended December 30, 2000 the deferred tax asset valuation allowance decreased by $13,134,520. This decrease was primarily the result of the Company’s analysis of the improvement in the likelihood of realizing the future tax benefit of the then existing tax attributes.
The reconciliation of income tax (provision) benefit that would result from applying the federal statutory rate to income tax (provision) benefit as shown in the accompanying Consolidated Statements of Income is as follows:
| 2000 |
2001 |
2002 |
|||||||
| Tax provision at federal statutory rate |
34.0 | % | 34.0 | % | 34.0 | % | |||
| State income taxes |
9.4 | 7.0 | 4.9 | ||||||
| General business and other tax credits |
(27.9 | ) | (8.6 | ) | (8.5 | ) | |||
| Other |
4.6 | 0.1 | 2.7 | ||||||
| 20.1 | 32.5 | 33.1 | |||||||
| Change in valuation allowance |
(457.1 | ) | 0.0 | 0.0 | |||||
| Effective tax rate |
(437.0 | )% | 32.5 | % | 33.1 | % | |||
F-22
RED ROBIN GOURMET BURGERS, INC.
NOTES TO CONSOLIDATED FINANCIAL STATEMENTS — (Continued)
The Company’s federal and state deferred taxes consist of the following as of fiscal year end (in thousands):
| 2001 |
2002 |
|||||||
| Alternative minimum tax credits |
$ | 1,446 | $ | 1,446 | ||||
| General business and other tax credits |
4,709 | 4,978 | ||||||
| Net operating losses – state |
175 | 125 | ||||||
| Property and equipment basis differences |
3,282 | 1,657 | ||||||
| Deferred rent |
1,714 | 1,804 | ||||||
| Reserves for doubtful accounts, salaries, vacations, insurance and other liabilities |
1,411 | 557 | ||||||
| Franchise Deposits |
214 | 343 | ||||||
| Other, net |
(8 | ) | 235 | |||||
| Workforce basis difference |
(473 | ) | — | |||||
| Franchise rights basis difference |
(2,151 | ) | (1,949 | ) | ||||
| Net deferred tax asset |
$ | 10,319 | $ | 9,196 | ||||
Realization of net deferred tax asset is dependent upon profitable operations and future reversals of existing taxable temporary differences. Although realization is not assured, the Company believes it is more likely than not that the net recorded benefits will be realized through the reduction of future taxable income. The amount of the net deferred tax assets considered realizable, however, could be reduced in the near term if actual future taxable income is lower than estimated, or if there are differences in the timing or amount of future reversals of existing taxable temporary differences.
As of December 29, 2002, the Company has state net operating losses totaling approximately $2.5 million available to reduce future taxes which expire through 2012. Additionally, the Company has federal alternative minimum tax credits of approximately $1.4 million available with no expiration date. The Company also has general business and other tax credits totaling approximately $5.0 million available to offset future taxes which expire through 2022.
13. Commitments And Contingencies
Leasing Activities — The Company leases land, buildings and equipment used in its operations under operating leases. Rent expense under two restaurant leases with the stockholders was $154,952, $207,415 and $219,475 during fiscal years 2000, 2001 and 2002, respectively. During June 2002 one of the two restaurants under lease with a related party was transferred to an independent third party. The Company also leases two other restaurants from an entity in which a franchisee has an ownership interest. One of these restaurants was acquired as part of the acquisition of SGC. Rent expense under these leases was $307,476 after the date of the SGC acquisition during fiscal 2000, $621,677 during fiscal 2001 and $606,757 during fiscal 2002.
The operating leases have terms ranging from one year to 25 years and generally contain renewal options which permit the Company to renew the leases at prevailing market rates. Certain equipment leases also include options to purchase equipment at the end of the lease term.
F-23
RED ROBIN GOURMET BURGERS, INC.
NOTES TO CONSOLIDATED FINANCIAL STATEMENTS — (Continued)
Land and building lease agreements require contingent rentals based on a percentage of stated sales volumes. Certain lease agreements also require the Company to pay maintenance, insurance and property tax costs. Rental expense related to land, building and equipment leases, including related parties, is as follows (in thousands):
| 2000 |
2001 |
2002 | |||||||
| Minimum rent |
$ | 7,493 | $ | 10,092 | $ | 12,050 | |||
| Percentage rent |
1,090 | 945 | 1,010 | ||||||
| Other rents |
256 | 276 | 312 | ||||||
| $ | 8,839 | $ | 11,313 | $ | 13,372 | ||||
The Company leases certain of its owned land, buildings and equipment to outside parties under non-cancelable operating leases. Cost of the leased land, buildings and equipment at December 30, 2001 and December 29, 2002 was $8,784,584 and $6,674,906, respectively, and related accumulated depreciation was $3,634,322 and $3,136,797, respectively.
Future minimum lease commitments and minimum rental income under all leases as of December 29, 2002 are as follows (in thousands):
| Capital Leases |
Operating Leases |
Rental Income | ||||||||
| 2003 |
$ | 1,776 | $ | 12,366 | $ | 332 | ||||
| 2004 |
1,816 | 11,836 | 341 | |||||||
| 2005 |
1,862 | 11,332 | 341 | |||||||
| 2006 |
1,914 | 10,644 | 341 | |||||||
| 2007 |
1,971 | 10,507 | 341 | |||||||
| Thereafter |
19,059 | 80,055 | 231 | |||||||
| Total |
28,398 | $ | 136,740 | $ | 1,927 | |||||
| Less amount representing interest at 8.4% to 13.4% |
(15,278 | ) | ||||||||
| Present value of future minimum lease payments |
13,120 | |||||||||
| Less current portion |
289 | |||||||||
| Long-term capital lease obligations |
$ | 12,831 | ||||||||
As of December 30, 2001 and December 29, 2002, property and equipment included $10,894,769 and $12,211,667 of assets under capital lease, respectively, and $1,944,502 and $2,224,715 of related accumulated depreciation, respectively.
Contingencies — In the normal course of business, the Company has various claims in process, matters in litigation and other contingencies. While it is not possible to predict the outcome of these suits, other legal proceedings and claims with certainty, management is of the opinion that adequate provision for potential losses has been made in the accompanying consolidated financial statements and that the ultimate resolution of these matters will not have a material adverse effect on the Company’s financial position, results of operation or cash flows.
Lease Termination Fee — During the second quarter of 2002, the Company realized a $944,985 non-recurring gain due to a landlord lease buy-out of an existing company-owned restaurant. As a result, the Company relocated the restaurant to a new location during June 2002. The lease termination fee received of $1.4 million has been presented net of related charges of approximately $0.2 million for the disposal of property and equipment from the original restaurant that was non-transferable and other non-recurring charges associated with the relocation of approximately $0.2 million.
F-24
RED ROBIN GOURMET BURGERS, INC.
NOTES TO CONSOLIDATED FINANCIAL STATEMENTS — (Continued)
14. Franchise Operations
Results of franchise operations consist of the following (in thousands):
| Fiscal Year |
Forty Weeks Ended | ||||||||||||||
| October 6, 2002 |
October 5, 2003 | ||||||||||||||
| 2000 |
2001 |
2002 |
|||||||||||||
| (unaudited) | |||||||||||||||
| Franchise royalties and fees |
|||||||||||||||
| Royalty income |
$ | 7,934 | $ | 8,521 | $ | 8,399 | $ | 6,515 | $ | 6,809 | |||||
| Franchise fees |
313 | 481 | 166 | 168 | 158 | ||||||||||
| Total franchise royalties and fees |
8,247 | 9,002 | 8,565 | 6,683 | 6,967 | ||||||||||
| Franchise development costs |
|||||||||||||||
| Payroll and employee benefit costs |
1,314 | 1,345 | 1,389 | 1,091 | 673 | ||||||||||
| General and administrative |
2,072 | 2,359 | 1,867 | 1,564 | 1,507 | ||||||||||
| Total franchise development costs |
3,386 | 3,704 | 3,256 | 2,655 | 2,180 | ||||||||||
| Operating income from franchise operations |
$ | 4,861 | $ | 5,298 | $ | 5,309 | $ | 4,028 | $ | 4,787 | |||||
15. Related Parties
In April 2002, the Company’s board of directors approved the early exercise of options to purchase up to 775,862 shares of common stock held by certain executive officers under the Company’s 2000 Stock Plan and the exercise of options to purchase an additional 146,552 shares of the Company’s common stock related to fully vested options held by certain executive officers under the Company’s 1990 and 1996 Stock Plans. These shares were issued in exchange for full recourse notes totaling $5.4 million, bearing interest at 4.65% per annum with maturity dates ranging from June 26, 2006 to January 29, 2012, or earlier if employment terminates. Shares issued upon early exercise of options are subject to a right of repurchase by the Company at the lower of fair value or issuance price until vested. The notes are recorded as a reduction of stockholders’ equity and interest income of $170,610 and $199,130 has been recognized during fiscal 2002 and the forty weeks ended October 5, 2003, respectively. As of December 29, 2002 and October 5, 2003, the number of fully vested early exercised options totaled 672,414 and 741,379, respectively, and unvested early exercise options totaled 103,448 and 34,483, respectively.
On May 11, 2000, the Company acquired SGC from certain officers of the Company, as described in Note 3. Royalty income for fiscal year 2000 includes $620,450 from the 14 restaurants operated by the SGC prior to its acquisition.
Mike Snyder and Bob Merullo, each an officer and a stockholder, have an ownership interest in one of the Company’s franchisees, Mach Robin, LLC (Mach Robin). Mike Snyder owns 31.0% and Bob Merullo owns 7.0%. The Company recognized franchise and royalty fees from Mach Robin in the amounts of $415,649, $803,198, $921,916 and $703,392 in fiscal years 2000, 2001, 2002 and the forty weeks ended October 5, 2003, respectively. Mach Robin has a 40.0% ownership interest and a right to share in up to 60.0% of the profits of one of the Company’s other franchisees, Red Robin Restaurants of Canada, Ltd (RRRC). The Company recognized franchise and royalty fees from RRRC of $940,670, $849,801, $785,618 and $654,560 in fiscal years 2000, 2001, 2002 and the forty weeks ended October 5, 2003, respectively.
As of December 30, 2001, December 29, 2002 and October 5, 2003, there are $600,000 of notes receivable from Mike Snyder which bear interest, compounded annually, at a rate of approximately 5.8%. The notes receivable
F-25
RED ROBIN GOURMET BURGERS, INC.
NOTES TO CONSOLIDATED FINANCIAL STATEMENTS — (Continued)
are collateralized by shares of the Company’s common stock and mature in May 2005. The notes are recorded as a reduction of stockholders’ equity, and interest income of $81,622 and $31,560, earned during fiscal 2002 and the forty weeks ended October 5, 2003, has been recorded as an increase in the carrying value of the notes.
One of the Company’s indoor plant maintenance supplier, Tropical Interiors, is operated by one of Mike Snyder’s brothers, Brad Snyder. The Company paid Tropical Interiors $152,279, $132,711, $199,740 and $179,114 in fiscal years 2000, 2001, 2002 and the forty weeks ended October 5, 2003, respectively.
The Company has engaged a legal firm to represent it on various matters, including acquisitions, financings, assistance with its initial public offering and other general corporate matters. A member of the Company’s board of directors is a partner of this firm. The Company paid this company $579,787, $163,470, $1.0 million and $117,900 in fiscal years 2000, 2001, 2002 and the forty weeks ended October 5, 2003, respectively.
The Company uses a privately held transportation and relocation service provider. The Chief Executive Officer of this company joined the Company’s board of directors during 2002. The Company paid this firm $106,087, $33,936, $281,544 and $61,409 in fiscal years 2000, 2001, 2002 and the forty weeks ended October 5, 2003, respectively.
16. Stockholders’ Equity
On June 4, 2002, the Company’s board of directors and shareholders approved a 1 for 2.9 reverse stock split. All share and per share amounts herein have been adjusted to reflect this reverse stock split as of the beginning of the first period presented.
On May 11, 2000, the Company sold 4,310,344 newly issued shares of common stock to a private equity firm, Quad-C Management, Inc. (Quad-C) for $25.0 million, or $5.80 per share. As a condition of the stock sale agreement, the Company converted $4.5 million in debt owed to Hibari Guam Corporation, an affiliated company, into 775,862 shares of the Company’s common stock. Concurrently with this transaction, the Company entered into a consulting services agreement with Quad-C pursuant to which the Company retained Quad-C to render consulting services. Expenses under this agreement were $140,887 in 2000, $184,615 in 2001 and $112,934 in 2002. This agreement terminated upon the consummation of the Company’s initial public offering.
In connection with the above transactions, the Company’s stockholders entered into a shareholders’ agreement dated May 11, 2000 whereby, among other matters, each stockholder has agreed to grant a right of first refusal to the Company and to the other stockholders in the event of receipt of an offer to acquire his shares. The shareholders’ agreement was terminated by a waiver and termination agreement between the Company’s stockholders effective as of the date of the closing of the Company’s initial public offering in July 2002.
During June 2003, the Company’s stockholders approved an amendment to the Company’s certificate of incorporation to reduce the authorized number of shares of common stock, $0.001 par value per share, from 50,000,000 shares to 30,000,000, and to reduce the authorized number of shares of the Company’s preferred stock, $0.001 par value per share, from 5,000,000 to 3,000,000 shares.
17. Stock Incentive Plans
The Company has four stock based compensation plans: the 1990 Incentive Stock Option and Nonqualified Stock Option Plan (the 1990 Stock Plan), the 1996 Stock Option Plan (the 1996 Stock Plan), the 2000 Management Performance Common Stock Option Plan (the 2000 Stock Plan), and the 2002 Incentive Stock Option Plan (2002 Stock Plan).
F-26
RED ROBIN GOURMET BURGERS, INC.
NOTES TO CONSOLIDATED FINANCIAL STATEMENTS — (Continued)
The 1990 Stock Plan was amended in 1996 to limit the number of shares to be granted to 241,379 shares of common stock. Stock option awards under the 1990 Stock Plan were granted at fair market value as estimated by the Board of Directors. In September 1996, the Company authorized 327,586 shares of common stock for issuance under its 1996 Stock Plan to key personnel. Pursuant to the original terms of the 1990 and 1996 Stock Plans, all options outstanding became 100% vested upon the change in control that occurred on May 11, 2000 in connection with the Quad-C equity investment and acquisition of SGC and related transactions. As of December 29, 2002 there are no remaining shares authorized for grant under the 1990 Stock Plan and 1996 Stock Plan.
The Company established the 2000 Stock Plan on May 11, 2000. Under the 2000 Stock Plan, options are granted to purchase common stock at the estimated fair market value at the date of grant. Vesting under the plan varies based on the attainment of certain financial results. The 2000 Stock Plan terminates at the close of business on April 15, 2010, however, during June 2002 the board of directors determined that no additional options will be granted under this plan. The 2000 Stock Plan reserved 1,131,724 shares of the Company’s common stock for option awards to employees and options to acquire a total of 1,103,234 million shares of the Company’s common stock were granted through December 29, 2002. During April 2002, the board of directors approved accelerated vesting of 694,827 options granted under the 2000 Stock Plan during fiscal 2002, including 603,448 early exercise options discussed further in Note 15.
In June 2002, the Company adopted, and its stockholders approved, a 2002 Stock Incentive Plan (2002 Stock Plan) under which the Company may grant stock options and other awards to employees, directors and consultants. A total of 900,000 shares of common stock are authorized for issuance with respect to awards granted under the 2002 Stock Plan. Awards under the 2002 Stock Plan may be in the form of nonqualified stock options, incentive stock options, stock appreciation rights (SARs), limited stock appreciation rights, or SARs limited to specific events, such as in a change in control or other special circumstances, restricted stock, performance share awards, or stock bonuses. Nonqualified stock options and other awards may be granted at prices below the fair market value of the common stock on the date of grant. Restricted stock awards can be issued for nominal or the minimum lawful consideration. Incentive stock options must have an exercise price that is at least equal to the fair market value of the common stock, or 110% of fair market value of the common stock for any 10% owner of the Company’s common stock, on the date of grant. Vesting of awards under the 2002 Stock Plan will vary, however, no award shall be exercisable or shall vest until at least one year after the initial award date. Each award granted under the 2002 Plan may, at the discretion of the plan administrator, become fully vested, exercisable, and/or payable, as applicable, upon a change of control event if the award will not be assumed or substituted for or otherwise continued after the event. Each award shall expire on such date as shall be determined at the date of grant, however, the maximum term of options, SARs and other rights to acquire common stock under the plan is ten years after the initial date of the award, subject to provisions for further deferred payment in certain circumstances. These and other awards may also be issued solely or in part for services. Any shares subject to awards that are not paid or exercised before they expire or are terminated will become available for other award grants under the 2002 Stock Plan. If not sooner terminated by the Company’s board of directors, the 2002 Stock Plan shall terminate on July 12, 2012. As of December 29, 2002, options to acquire a total of 14,000 shares of the Company’s common stock have been granted under the 2002 Stock Plan at a price equal to fair market value on the respective dates of grant.
F-27
RED ROBIN GOURMET BURGERS, INC.
NOTES TO CONSOLIDATED FINANCIAL STATEMENTS — (Continued)
A summary of the status of the Company’s four stock based compensation plans and changes during the periods then ended is presented below (in thousands, except per share data):
| 2000 |
2001 |
2002 | ||||||||||||||||
| Shares |
Weighted Average Exercise Price |
Shares |
Weighted Average Exercise Price |
Shares |
Weighted Average Exercise Price | |||||||||||||
| Outstanding, beginning of year |
540 | $ | 5.80 | 1,413 | $ | 5.80 | 1,413 | $ | 5.86 | |||||||||
| Awards granted |
960 | 5.80 | 136 | 6.53 | 131 | 11.27 | ||||||||||||
| Awards forfeited |
(80 | ) | 5.80 | (132 | ) | 5.80 | (48 | ) | 7.40 | |||||||||
| Awards exercised |
(7 | ) | 5.80 | (4 | ) | 5.80 | (1,018 | ) | 5.85 | |||||||||
| Outstanding, end of year |
1,413 | $ | 5.80 | 1,413 | $ | 5.86 | 478 | $ | 7.23 | |||||||||
The following table summarizes information about stock options outstanding at December 29, 2002 (in thousands, except per share data and contractual life):
| Outstanding |
Exercisable | |||||||||||
| Range of Exercise Prices |
Number Options |
Weighted Average Remaining Years of Contractual Life |
Weighted Price |
Number of Options |
Weighted Price | |||||||
| $5.80 - 7.25 |
405 | 6.34 | $ | 6.06 | 261 | $ | 5.82 | |||||
| $12.55 - $14.01 |
73 | 9.50 | 13.82 | — | — | |||||||
| 478 | 6.82 | $ | 7.23 | 261 | $ | 5.82 | ||||||
During the forty weeks ended October 5, 2003, 444,500 employee stock options have been granted under the Company’s 2002 Stock Plan at a weighted-average exercise price of $15.50 per share. In each case, the exercise price was equal to the closing market price on the date of grant.
18. Employee Benefit Programs
Employee Stock Purchase Plan — In June 2002, the Company adopted, and its stockholders approved, an Employee Stock Purchase Plan (2002 ESPP) under which eligible employees may voluntarily contribute up to 15% of their salary, subject to limitations, to purchase common stock at a price equal to 85% of the fair market value of a share of the Company’s common stock on the first day of each offering period or 85% of the fair market value of a share of the Company’s common stock on the last day of each offering period, whichever amount is less. A total of 300,000 shares of common stock are available under the 2002 ESPP. Generally, all of the Company’s officers and employees who have been employed by the Company for at least one year and who are regularly scheduled to work more than twenty hours per week are eligible to participate in the 2002 ESPP. The 2002 ESPP will generally operate in successive six-month periods, or offering periods, commencing on each January 1 and July 1. The first six-month offering period commenced on January 1, 2003. As of October 5, 2003, a total of 9,262 shares have been issued and 290,738 shares remain available for future issuance.
F-28
RED ROBIN GOURMET BURGERS, INC.
NOTES TO CONSOLIDATED FINANCIAL STATEMENTS — (Continued)
Employee Defined Contribution Plan — In 1990, the Company adopted the Red Robin International 401(k) Savings Plan (the 401k Plan) which covers substantially all of its eligible employees. The 401k Plan, which qualifies under Section 401(k) of the Internal Revenue Code, allows employees to defer specified percentages of their compensation (as defined) in a tax-exempt trust. The Company may make matching contributions in an amount determined by the Board of Directors. In addition, the Company may contribute each period, at its discretion, an additional amount from profits. There were no Company contributions for the fiscal year ended 2000, 2001, and 2002.
Deferred Compensation Plan — Effective January 1, 2003, the Company adopted a deferred compensation plan that permits management and highly compensated employees to defer portions of their compensation. The salaries that have been deferred since the plan’s inception, and related investment income thereon, total $450,000 at October 5, 2003 and are included in the Company’s financial statements under “accrued payroll and payroll-related liabilities.” Administrative expenses of the plan are paid by the Company. To fund this plan, the Company purchases corporate-owned whole-life insurance contracts on the related employees. The cash surrender value of these policies, totaling $417,000 at October 5, 2003, is included in “other assets, net.”
19. Subsequent Events
On May 20, 2003, the Company amended its three-year $40.0 million revolving credit facility, which was originally entered into on July 24, 2002. Under the amended terms of the credit agreement, the Company’s borrowing capacity was increased from $40.0 million to $85.0 million. In addition, the term of the credit agreement was extended and will now expire on May 19, 2006. This facility is in place to fund the construction and acquisition of new restaurants, to refinance existing indebtedness and for general corporate purposes, including working capital.
The amended revolving credit facility is secured by a first priority pledge of all of the outstanding capital stock of the Company’s subsidiaries and a first priority lien on substantially all of the Company’s tangible and intangible assets. Borrowings under the amended revolving credit facility bear interest at one of the following rates as selected by the Company: an Alternate Base Rate (ABR), which is based on the Prime Rate plus 1.0% to 1.75%, or a London Interbank Offered Rate (LIBOR), which is based on the relevant one, two, three or six month LIBOR, at the Company’s discretion, plus 2.0% to 2.75%. The spread, or margin, for ABR and LIBOR loans is adjusted quarterly based on our then current leverage ratio. Interest payments on ABR loans are due the last day of each March, June, September and December and on the maturity date. Interest payments on LIBOR loans having an interest period of three months or less are due the last day of such interest period. Interest payments on LIBOR loans having an interest period longer than three months are due every three months after the first day of the interest period and also on the last day of such interest period. In addition, the Company may borrow up to $3.0 million under a swingline loan subfacility if the sum of the outstanding ABR and LIBOR loans, swingline loans and letters of credit do not exceed $85.0 million. Swingline loans under the amended credit agreement bear interest at a per annum rate equal to the prime rate plus 1.0% to 1.75%.
The Company paid approximately $756,000 in fees related to amending its revolving credit facility. These fees will be deferred and amortized ratably over the remaining term of the amended credit agreement. The amended revolving credit facility is also subject to a commitment fee of 0.5% per annum on the average daily unused portion of the revolver. In addition, the Company must pay a fee in consideration of letter of credit commitments equal to 2.0% to 2.75% on the average daily maximum amount available to be drawn under each letter of credit from the date of issuance to the date of expiration. The Company must also pay the reasonable and customary charges of its lenders with respect to the amendment, transfer, administration, cancellation and conversion of, and drawings under, letters of credit. Commitment and letter of credit fees are payable quarterly, in arrears on the 15th day following the last day of each calendar quarter.
F-29
RED ROBIN GOURMET BURGERS, INC.
NOTES TO CONSOLIDATED FINANCIAL STATEMENTS — (Continued)
The amended revolving credit facility requires that the Company comply with a maximum leverage ratio as well as a minimum fixed charge coverage ratio, and minimum earnings before interest, taxes, depreciation and amortization (EBITDA) requirements. In addition, the Company must comply with certain consolidated capital expenditure maximums and operating lease restrictions. The credit agreement restricts the Company’s ability to, among other things, engage in mergers, acquisitions, joint ventures and sale-leaseback transactions, and to sell assets, incur indebtedness, make investments, create liens and pay dividends.
20. Quarterly Results of Operations (Unaudited)
The following summarizes the Company’s unaudited quarterly results of operations for 2001 and 2002 and the forty weeks ended October 5, 2003 (in thousands, except per share data):
| 16 Weeks Ended |
12 Weeks Ended | |||||||||||
| Forty Weeks Ended October 5, 2003 | April 20 |
July 13 |
October 5 |
|||||||||
| Total revenues |
$ | 92,892 | $ | 75,592 | $ | 79,320 | ||||||
| Income from operations |
6,110 | 6,711 | 6,822 | |||||||||
| Net income |
3,531 | 4,035 | 3,975 | |||||||||
| Basic earnings per share |
0.24 | 0.27 | 0.26 | |||||||||
| Diluted earnings per share |
$ | 0.23 | $ | 0.26 | $ | 0.26 | ||||||
| Year Ended December 29, 2002 | April 21 |
July 14 |
October 6 |
December 29 | ||||||||
| Total revenues |
$ | 79,201 | $ | 65,056 | $ | 64,586 | $ | 65,567 | ||||
| Income from operations |
6,019 | 5,885 | 5,681 | 4,572 | ||||||||
| Net income |
2,476 | 2,732 | 389 | 2,667 | ||||||||
| Basic earnings per share |
0.25 | 0.27 | 0.03 | 0.18 | ||||||||
| Diluted earnings per share |
$ | 0.23 | $ | 0.25 | $ | 0.03 | $ | 0.18 | ||||
| Year Ended December 30, 2001 | April 22 |
July 15 |
October 7 |
December 30 | ||||||||
| Total revenues |
$ | 67,514 | $ | 52,040 | $ | 52,035 | $ | 52,896 | ||||
| Income from operations |
5,127 | 5,140 | 4,450 | 4,023 | ||||||||
| Net income |
1,871 | 2,372 | 1,830 | 1,651 | ||||||||
| Basic earnings per share |
0.19 | 0.24 | 0.18 | 0.16 | ||||||||
| Diluted earnings per share |
$ | 0.18 | $ | 0.23 | $ | 0.18 | $ | 0.16 | ||||
Certain amounts in each of the quarterly periods for the year ended December 29, 2002 and the first two quarterly periods of the forty weeks ended October 5, 2003 have been reclassified to conform to the 12 weeks ended October 5, 2003 presentation. The reclassifications relate to losses for the disposal of retired assets and fee income from various states for sales tax collection efforts, both of which were previously included in the caption other income/expense. A reconciliation of income from operations to previously reported amounts is presented below:
| Quarter ended |
As previously reported |
Reclassification |
After reclassification | |||||||
| April 21, 2002 |
$ | 5,993 | $ | 26 | $ | 6,019 | ||||
| July 14, 2002 |
$ | 5,864 | $ | 21 | $ | 5,885 | ||||
| October 6, 2002 |
$ | 5,662 | $ | 19 | $ | 5,681 | ||||
| December 29, 2002 |
$ | 4,541 | $ | 31 | $ | 4,572 | ||||
| April 20, 2003 |
$ | 6,165 | $ | (55 | ) | $ | 6,110 | |||
| July 13, 2003 |
$ | 6,787 | $ | (76 | ) | $ | 6,711 | |||
F-30
3,458,673 Shares
Common Stock
Prospectus
November 7, 2003
Banc of America Securities LLC
Wachovia Securities
U.S. Bancorp Piper Jaffray
SunTrust Robinson Humphrey
Harris Nesbitt Gerard
McDonald Investments Inc.
PART II. INFORMATION NOT REQUIRED IN PROSPECTUS
Item 14. Other Expenses of Issuance and Distribution.
The following expenses incurred in connection with the sale of the securities being registered will be borne by the Registrant. Other than the SEC registration fee and Nasdaq filing fee, the amounts stated are estimates.
| Registration fee — Securities and Exchange Commission |
$ | 8,958 | |
| Accounting fees and expenses |
100,000 | ||
| Legal fees and expenses |
225,000 | ||
| NASD |
11,573 | ||
| Nasdaq |
10,000 | ||
| Printing |
150,000 | ||
| Miscellaneous |
244,469 | ||
| Total |
$ | 750,000 | |
Item 15. Indemnification of Directors and Officers
Our amended and restated bylaws provide that we shall indemnify our directors and officers to the fullest extent permitted by Delaware law, provided that, with respect to proceedings initiated by our officers and directors, we are only required to indemnify these persons if the proceeding was authorized by our board of directors. Our bylaws permit us, by action of our board of directors, to indemnify our other employees and agents to the same extent as we are required to indemnify our officers and directors. We are also empowered under our bylaws to enter into indemnification agreements with our directors, officers, employees or agents and to purchase insurance on behalf of any of our director, officer, employee or agent whether or not we are required or permitted to indemnify such persons under Delaware law.
We have entered into indemnification agreements with certain of our directors and executive officers and intend to enter into indemnification agreements with all of our other directors and executive officers prior to the consummation of this offering. Under these agreements, we will indemnify our directors and executive officers against amounts actually and reasonably incurred in connection with actual or threatened proceedings if any of them may be made a party because of their role as one of our directors or officers. We are obligated to pay these amounts only if the officer or director acted in good faith and in a manner that he or she reasonably believed to be in or not opposed to our best interests. For any criminal proceedings, we are obligated to pay these amounts only if the officer or director had no reasonable cause to believe his or her conduct was unlawful. The indemnification agreements also set forth procedures that will apply in the event of a claim for indemnification thereunder.
In addition, our amended and restated bylaws provide that our directors will not be personally liable to us or our stockholders for monetary damages for any breach of fiduciary duty as a director, except for liability:
| • | for any breach of the director’s duty of loyalty to us or our stockholders; |
| • | for acts or omissions not in good faith or which involve intentional misconduct or a knowing violation of law; |
| • | under Section 174 of the Delaware General Corporation Law; or |
| • | for any transaction from which the director derives an improper personal benefit. |
There is no pending litigation or proceeding involving any of our directors or officers for which indemnification is being sought, nor are we aware of any pending or threatened litigation that may result in claims for indemnification by any director or officer.
II-1
Item 16. Exhibits.
(a) Exhibits
| Exhibit No. |
Item and Reference | |
| 1.1 |
Form of Underwriting Agreement | |
| 4.1 |
Specimen stock certificate. Incorporated by reference to Amendment No. 1 of the Company’s Registration Statement on Form S-1 dated June 10, 2002 (Registration No. 333-87044). | |
| 5.1 † |
Opinion of O’Melveny & Myers LLP. | |
| 23.1 |
Consent of Deloitte & Touche LLP, Independent Auditors. | |
| 23.2† |
Consent of O’Melveny & Myers LLP. Reference is made to Exhibit 5.1. | |
| 24.1† |
Power of Attorney. |
| † | Previously filed |
II-2
Item 17. Undertakings.
The Registrant hereby undertakes to provide to the underwriter at the closing specified in the underwriting agreements certificates in such denominations and registered in such names as required by the underwriter to permit prompt delivery to each purchaser.
Insofar as indemnification for liabilities arising under the Securities Act of 1933 may be permitted to directors, officers and controlling persons of the registrant pursuant to the foregoing provisions or otherwise, the registrant has been advised that in the opinion of the Securities and Exchange Commission such indemnification is against public policy as expressed in the Act and is, therefore, unenforceable. In the event that a claim for indemnification against such liabilities (other than the payment by the registrant of expenses incurred or paid by a director, officer or controlling person of the registrant in the successful defense of any action, suit or proceeding) is asserted by such director, officer or controlling person in connection with the securities being registered, the Registrant will, unless in the opinion of its counsel the matter has been settled by controlling precedent, submit to a court of appropriate jurisdiction the question whether such indemnification by it is against public policy as expressed in the Act and will be governed by the final adjudication of such issue.
The undersigned Registrant hereby undertakes that:
| (1) | For purposes of determining any liability under the Securities Act of 1933, the information omitted from the form of prospectus filed as part of this Registration Statement in reliance upon Rule 430A and contained in a form of prospectus filed by the Registrant pursuant to Rule 424(b)(1) or (4) or 497(h) under the Securities Act shall be deemed to be part of this Registration Statement as of the time it was declared effective. |
| (2) | For the purpose of determining any liability under the Securities Act, each post-effective amendment that contains a form of prospectus shall be deemed to be a new registration statement relating to the securities offered therein, and the offering of such securities at that time shall be deemed to be the initial bona fide offering thereof. |
II-3
SIGNATURES
Pursuant to the requirements of the Securities Act of 1933, the Registrant certifies that it has reasonable grounds to believe that it meets all of the requirements for filing on Form S-3 and has duly caused this amendment to the Registration Statement to be signed on its behalf by the undersigned, thereunto duly authorized, in the City of Greenwood Village, State of Colorado, on November 7, 2003.
| Red Robin Gourmet Burgers, Inc. (Registrant) | ||||||||
| November 7, 2003 (Date) |
By: | /s/ Michael J. Snyder (Michael J. Snyder, Chairman of the Board, President and Chief Executive Officer) | ||||||
Pursuant to the requirements of the Securities Act of 1933, this amendment to the Registration Statement has been signed below by the following persons in the capacities and on the dates indicated:
| Signature |
Title |
Date | ||
| /s/ Michael J. Snyder Michael J. Snyder |
Chairman of the Board, President, Chief Executive Officer (Principal Executive Officer) | November 7, 2003 | ||
| /s/ James P. McCloskey James P. McCloskey |
Chief Financial Officer (Principal Financial and Accounting Officer) | November 7, 2003 | ||
| * Edward T. Harvey |
Director | November 7, 2003 | ||
| * Terrence D. Daniels |
Director | November 7, 2003 | ||
| * Gary J. Singer |
Director | November 7, 2003 | ||
| * Dennis B. Mullen |
Director | November 7, 2003 | ||
| * Benjamin D. Graebel |
Director | November 7, 2003 | ||
| *By: | /s/ Michael J. Snyder | |
| Michael J. Snyder Attorney-in-Fact | ||
II-4